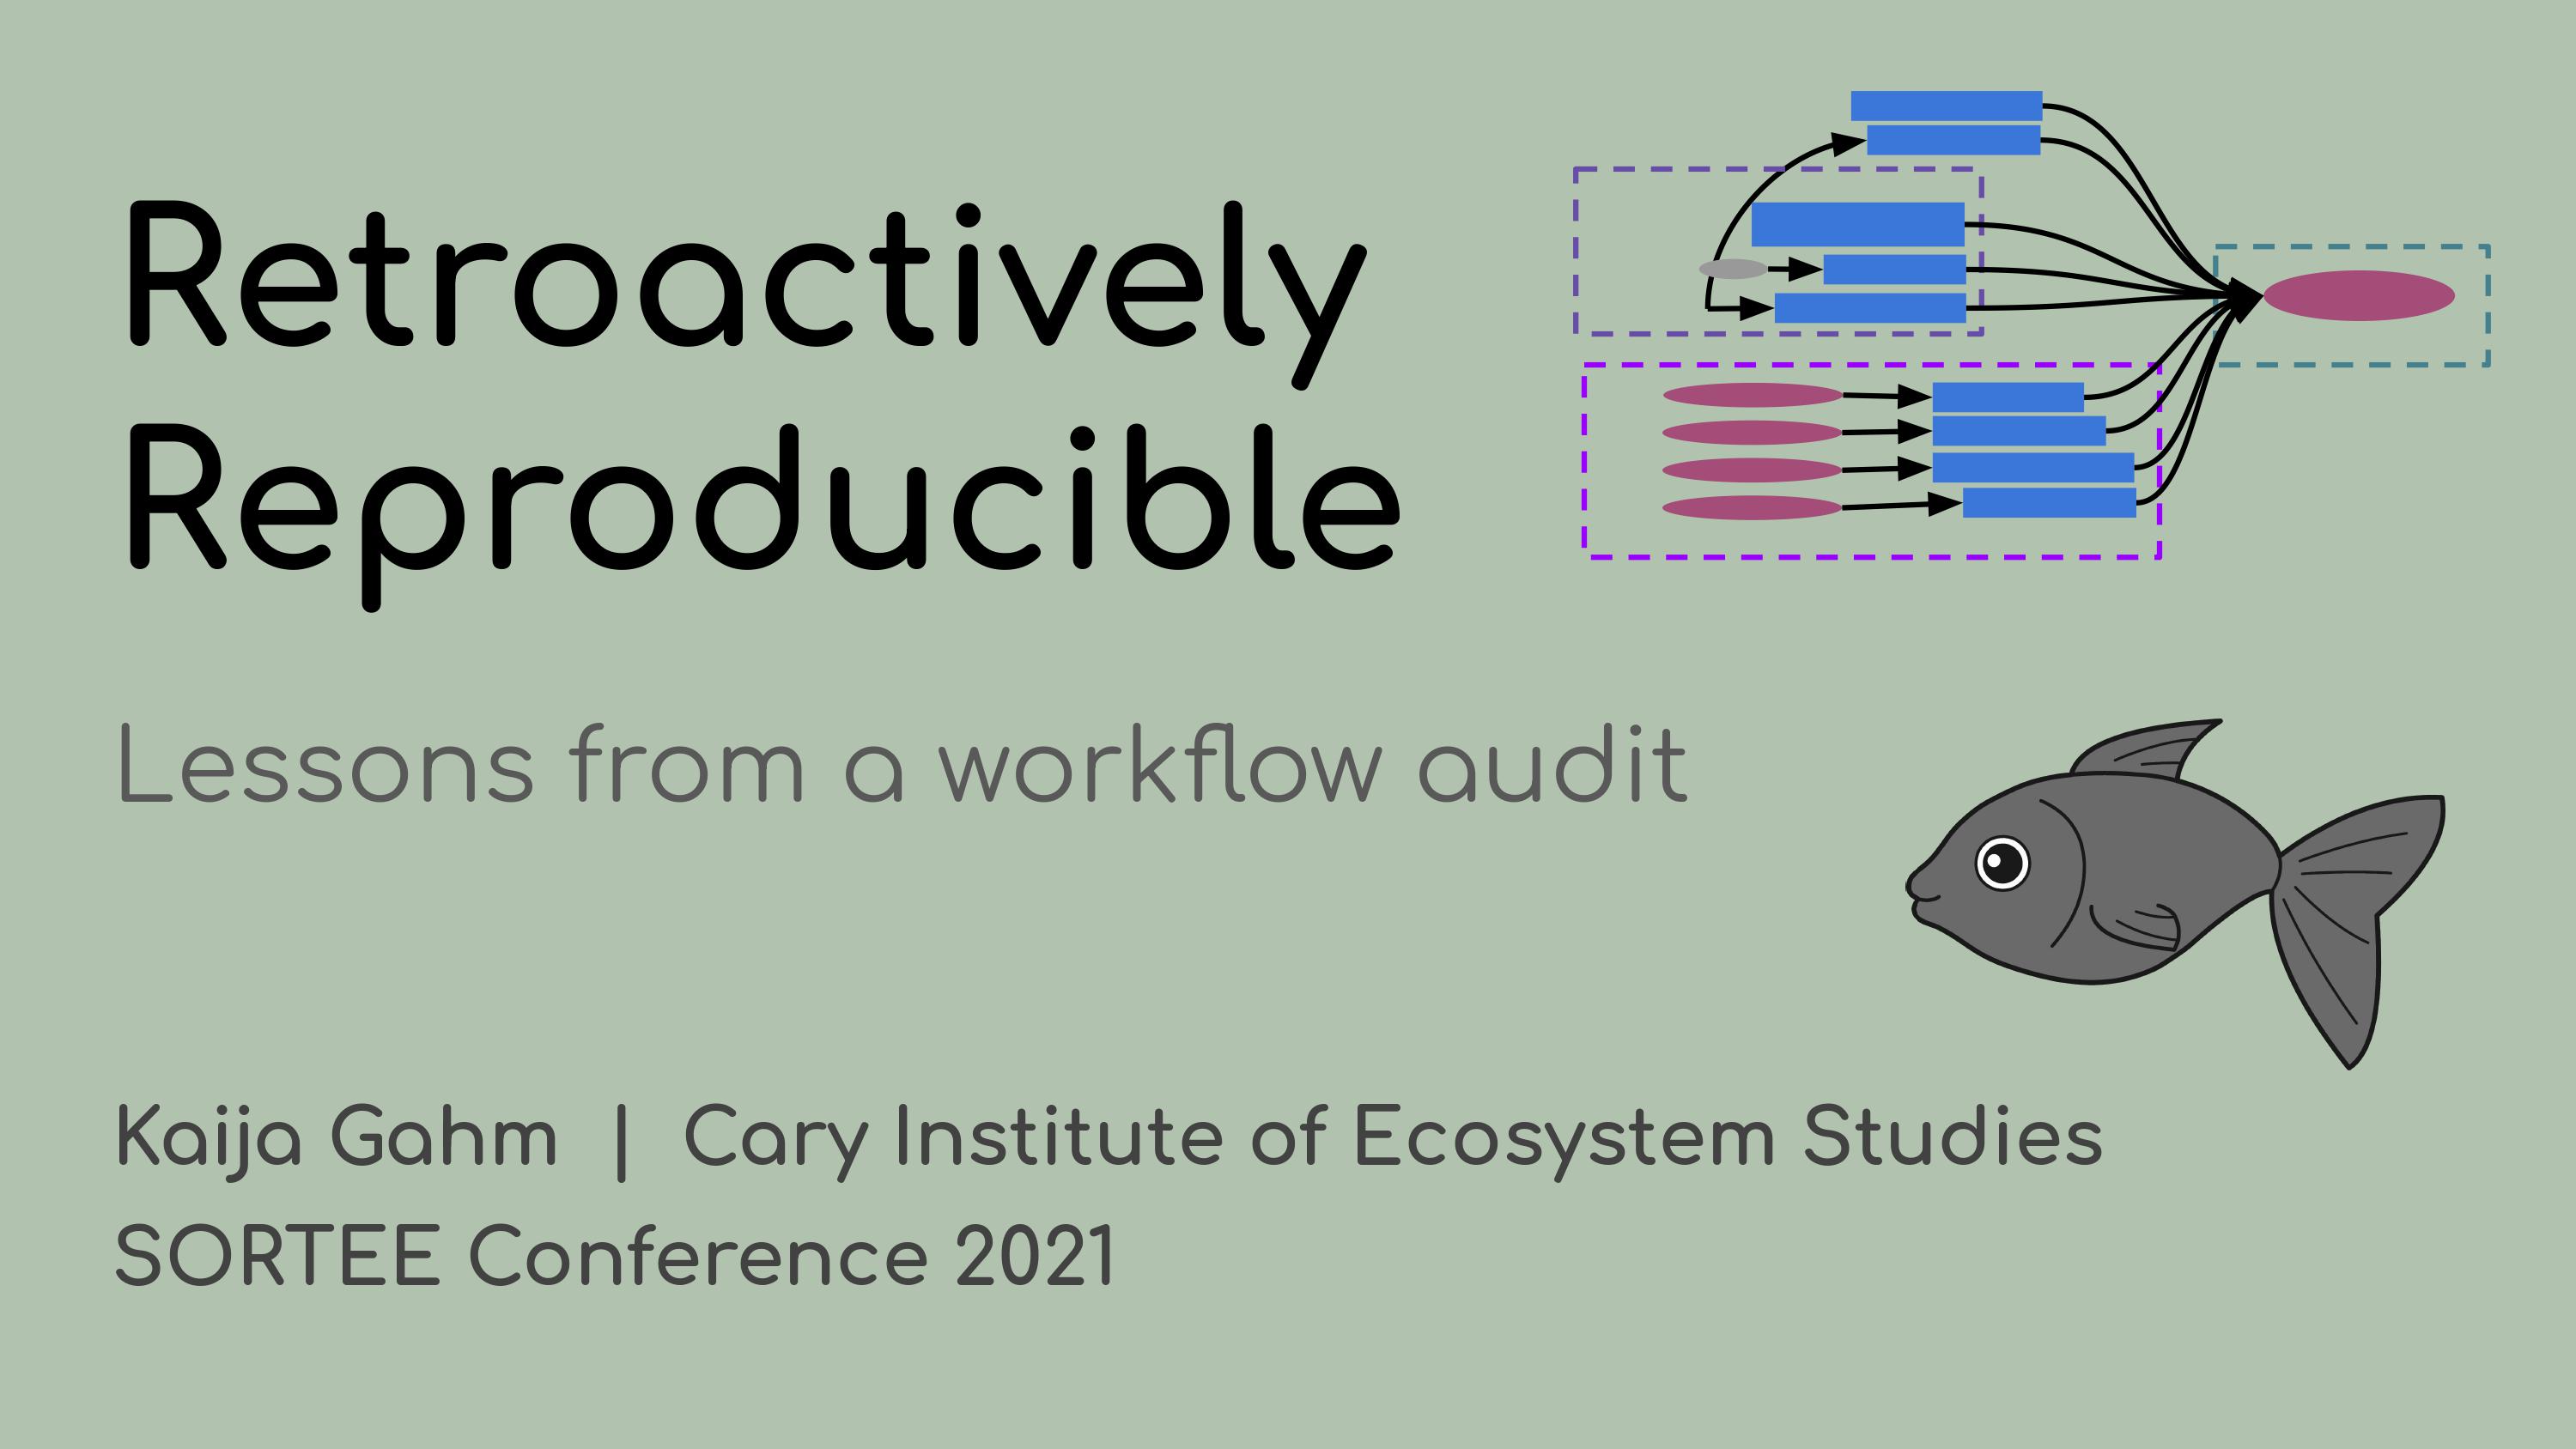
At the 2021 SORTEE conference this past summer, I gave a talk about my experience conducting a reproducibility audit and cleaning up a colleague’s workflow as she prepared to publish her M.S. thesis research.
Here, I’m embedding the video of the talk, and also reproducing it as a blog post (slides and captions) in case you’d rather read than listen/watch.
The slide descriptions are a pretty direct transcription of what I said during the talk, so if the style seems strange for a blog post, that’s why.
Scroll down to watch the video!
Slides and descriptions
 Hello everyone! Thank you for
being here. My name is Kaija Gahm, and I’m a data manager at the Cary
Institute of Ecosystem Studies. Late last year, my colleague Chelsea had
just finished her Master’s thesis, and my supervisor asked me to help
her to organize her code and analysis into a reproducible workflow that
we could reference in the manuscript that we were putting together.
Hello everyone! Thank you for
being here. My name is Kaija Gahm, and I’m a data manager at the Cary
Institute of Ecosystem Studies. Late last year, my colleague Chelsea had
just finished her Master’s thesis, and my supervisor asked me to help
her to organize her code and analysis into a reproducible workflow that
we could reference in the manuscript that we were putting together.
In this talk, I’m going to be speaking about my experience
implementing data management and reproducibility tools retroactively,
for an existing project, even if best practices weren’t used from the
beginning. I’ll also discuss organizing and making sense of someone
else’s analyses, approaching the project as an outsider. A little bit of background on the project:
It consisted of some pretty typical ecological data––measurements of
lake dissolved organic carbon, morphometric landmarks of bluegill
sunfish, and a bunch of statistical analyses and
figures.
A little bit of background on the project:
It consisted of some pretty typical ecological data––measurements of
lake dissolved organic carbon, morphometric landmarks of bluegill
sunfish, and a bunch of statistical analyses and
figures. Some of the
challenges I knew I was going to face were that the data had largely
been edited manually in Excel, or copied and pasted from other files
with uncertain origin.
Some of the
challenges I knew I was going to face were that the data had largely
been edited manually in Excel, or copied and pasted from other files
with uncertain origin.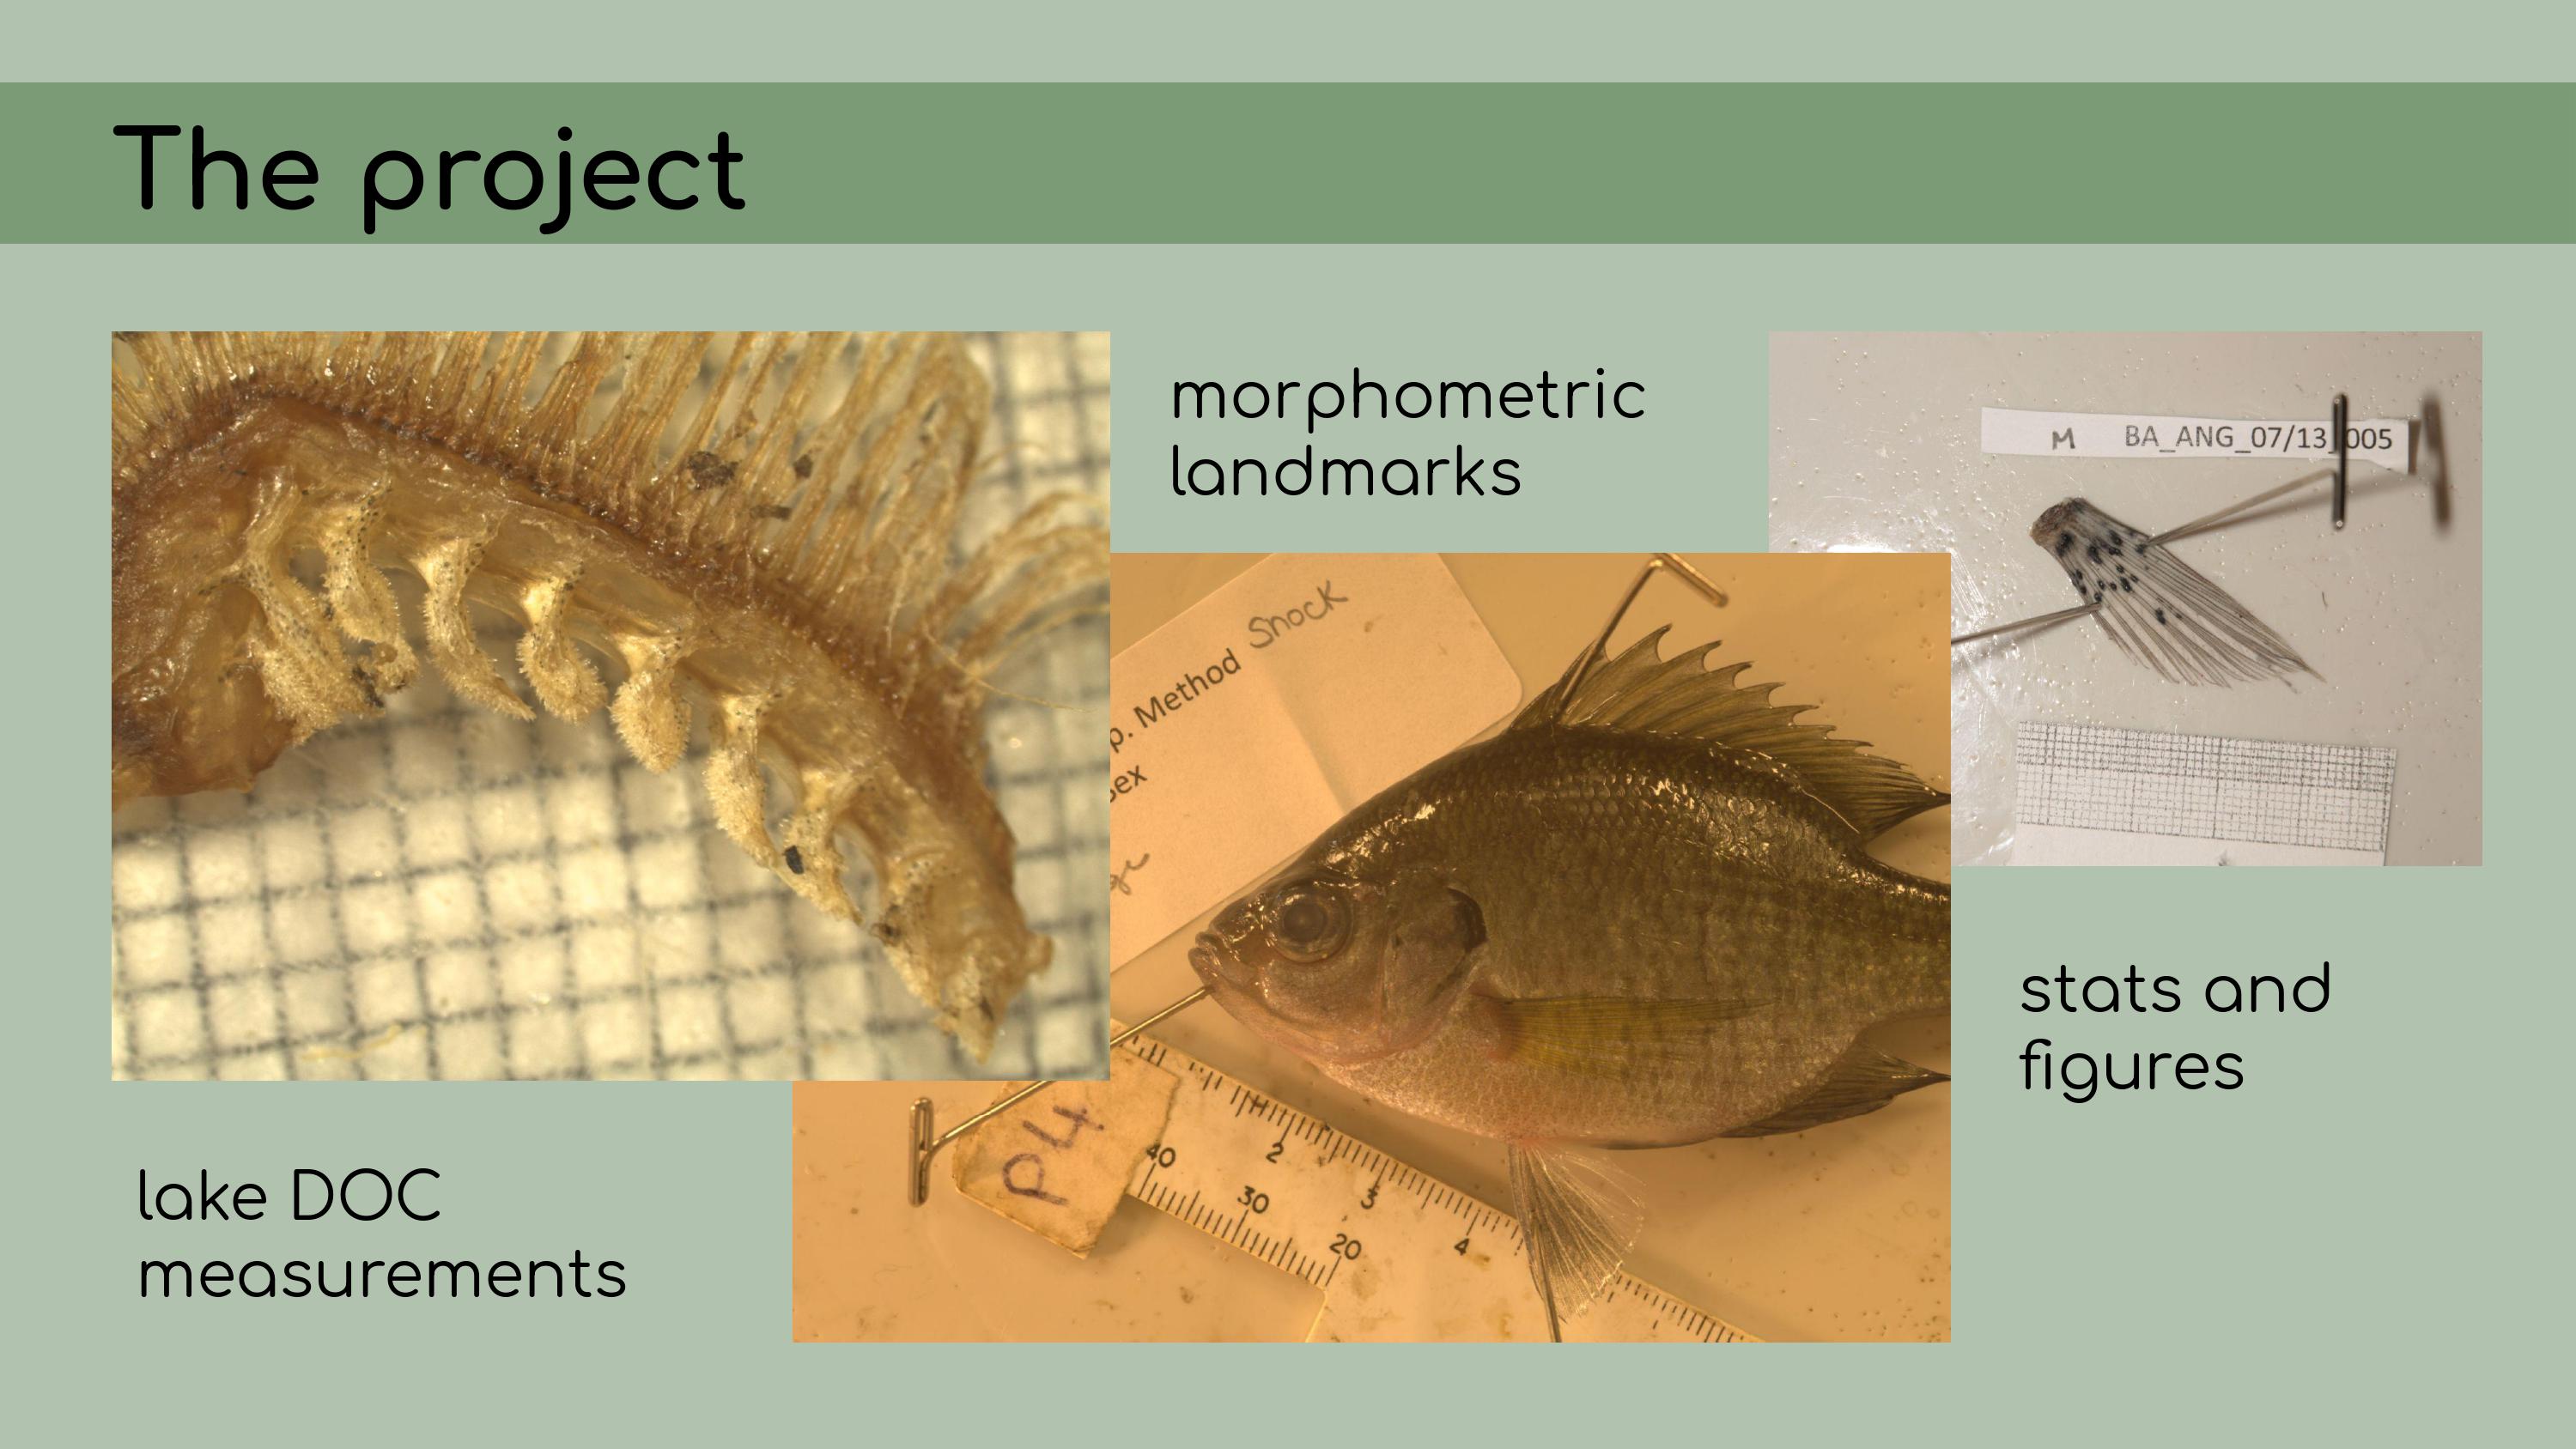 There were many file versions, and it
wasn’t really clear how the data and code tied together.
There were many file versions, and it
wasn’t really clear how the data and code tied together. The goal of my work was to compile all
of this data and code into a reproducible analysis. I knew that we were
going to be storing the data on Figshare; all of the analyses would be
conducted in RStudio and stored on GitHub. The data and code could be
then referenced in the final manuscript.
The goal of my work was to compile all
of this data and code into a reproducible analysis. I knew that we were
going to be storing the data on Figshare; all of the analyses would be
conducted in RStudio and stored on GitHub. The data and code could be
then referenced in the final manuscript.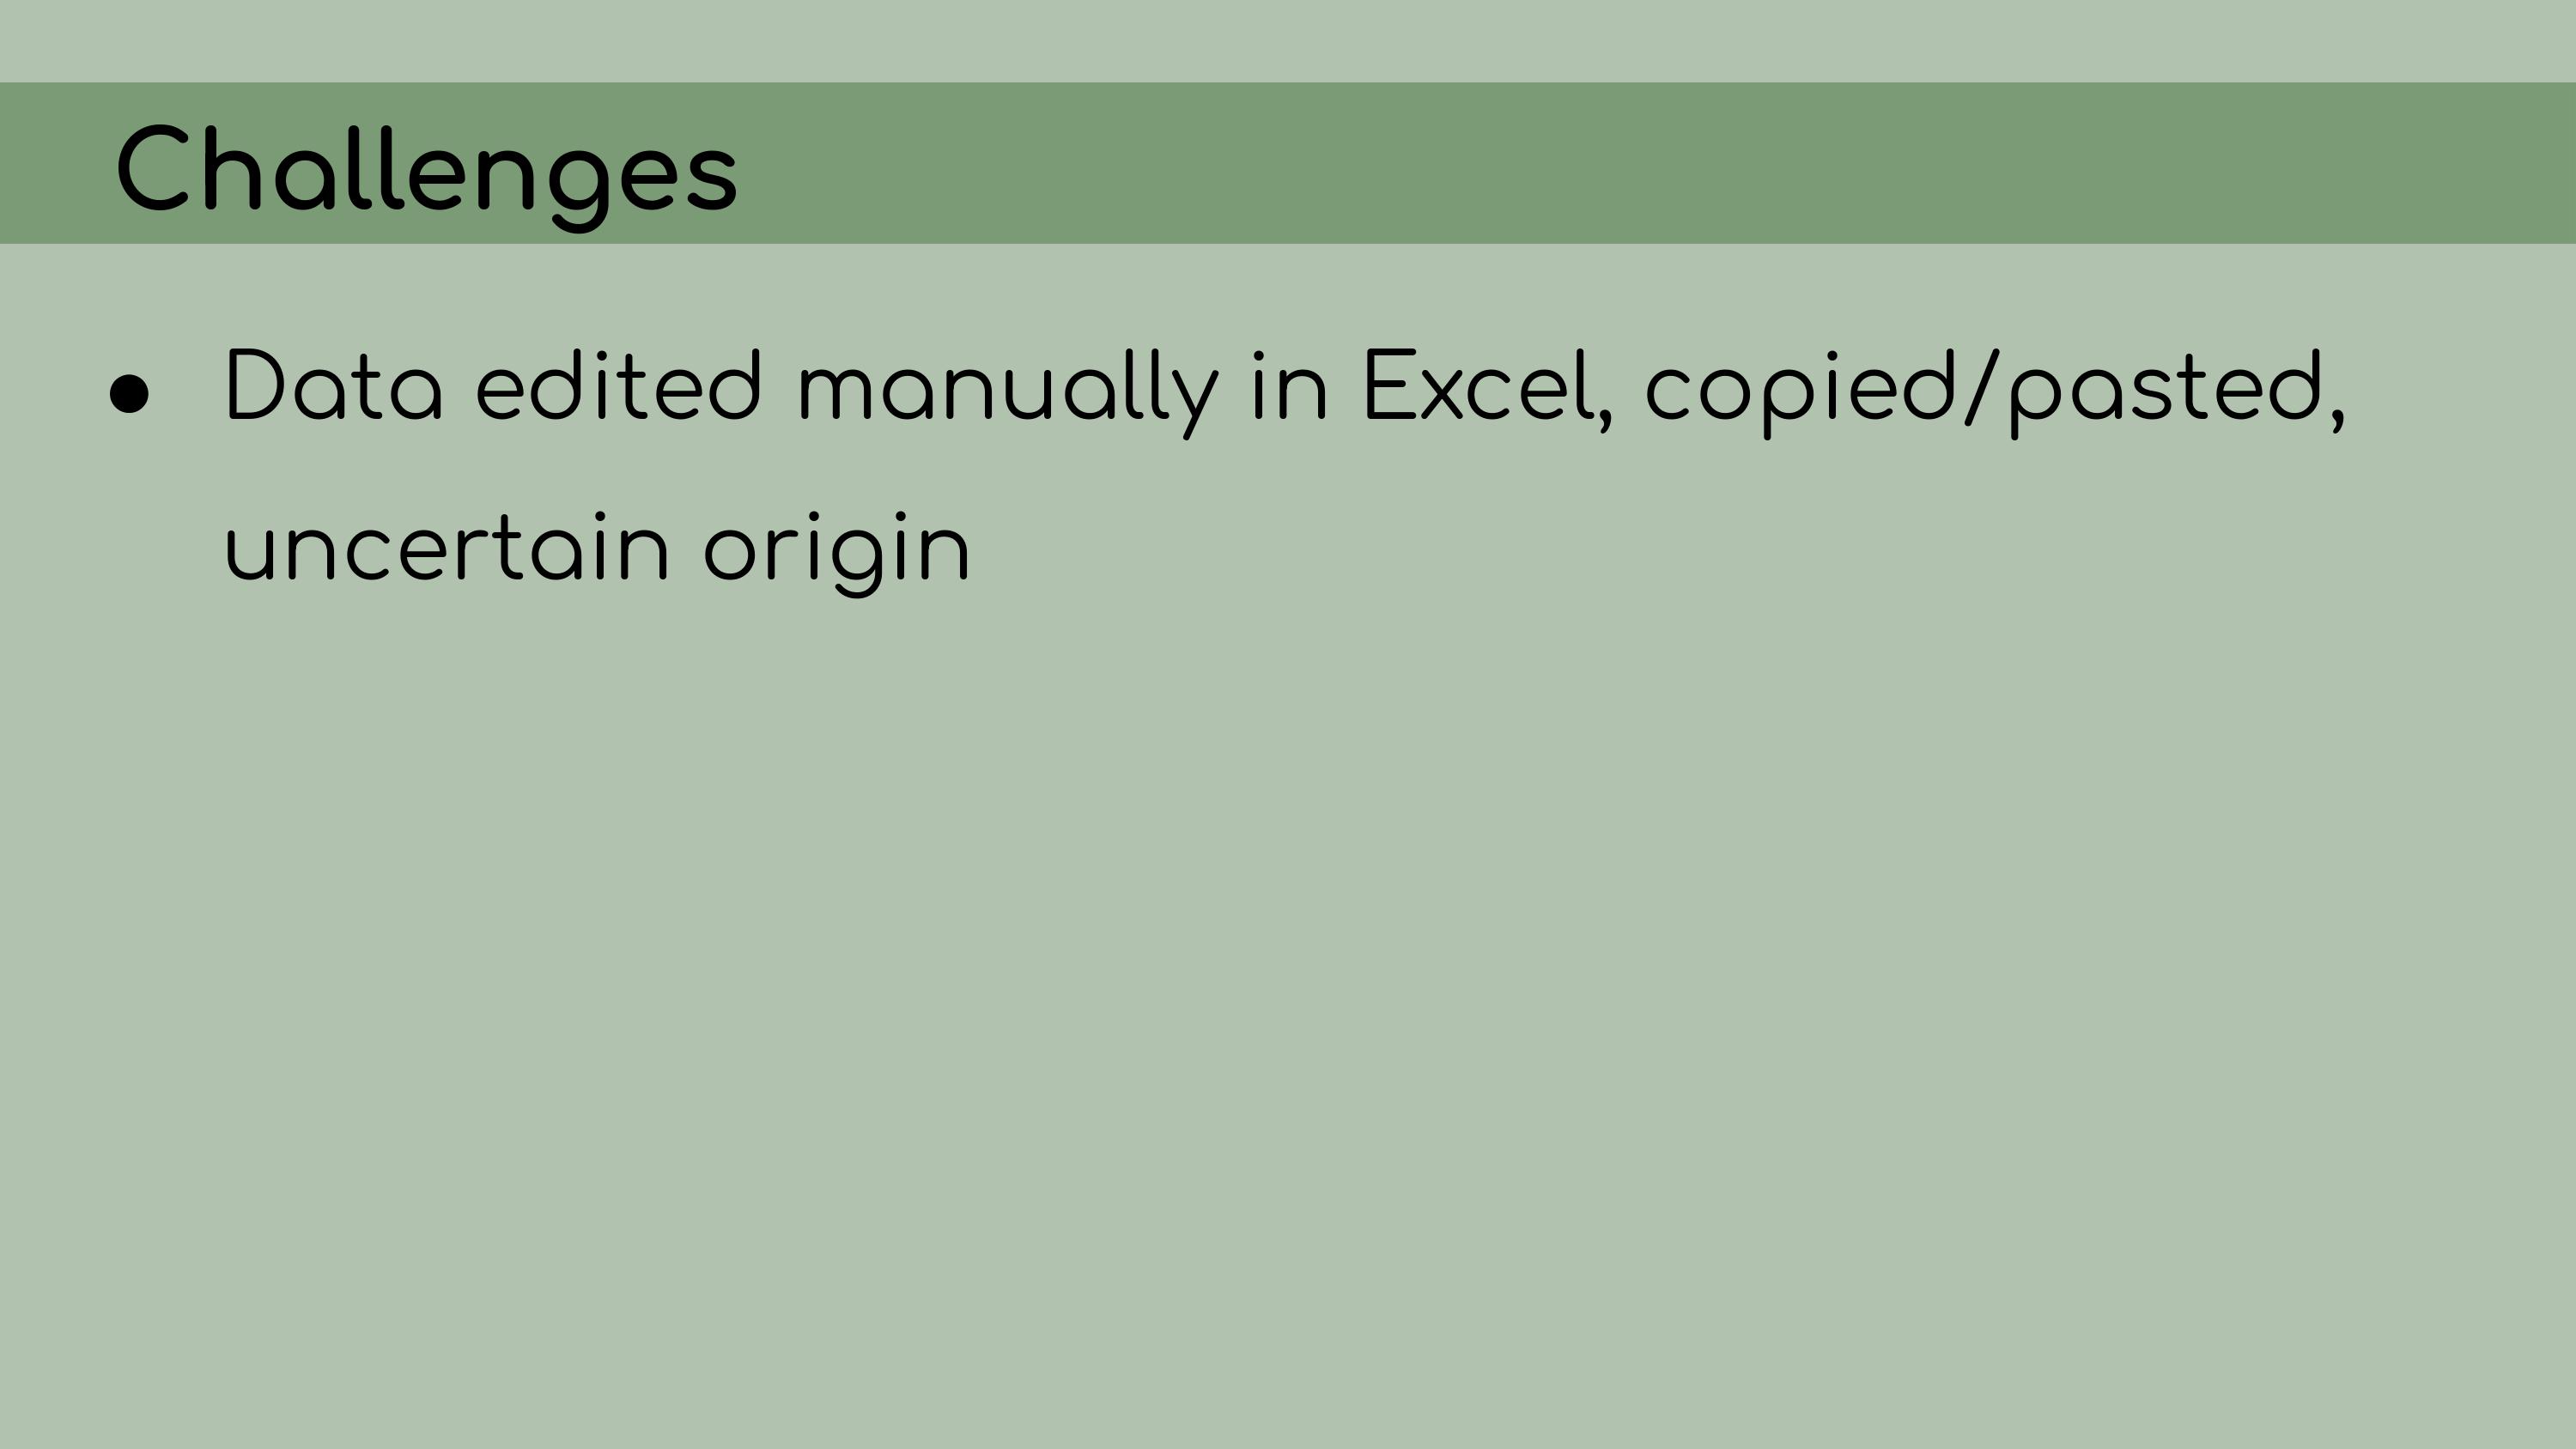 To begin my work, I asked Chelsea to start
by uploading all of her files to GitHub.
To begin my work, I asked Chelsea to start
by uploading all of her files to GitHub.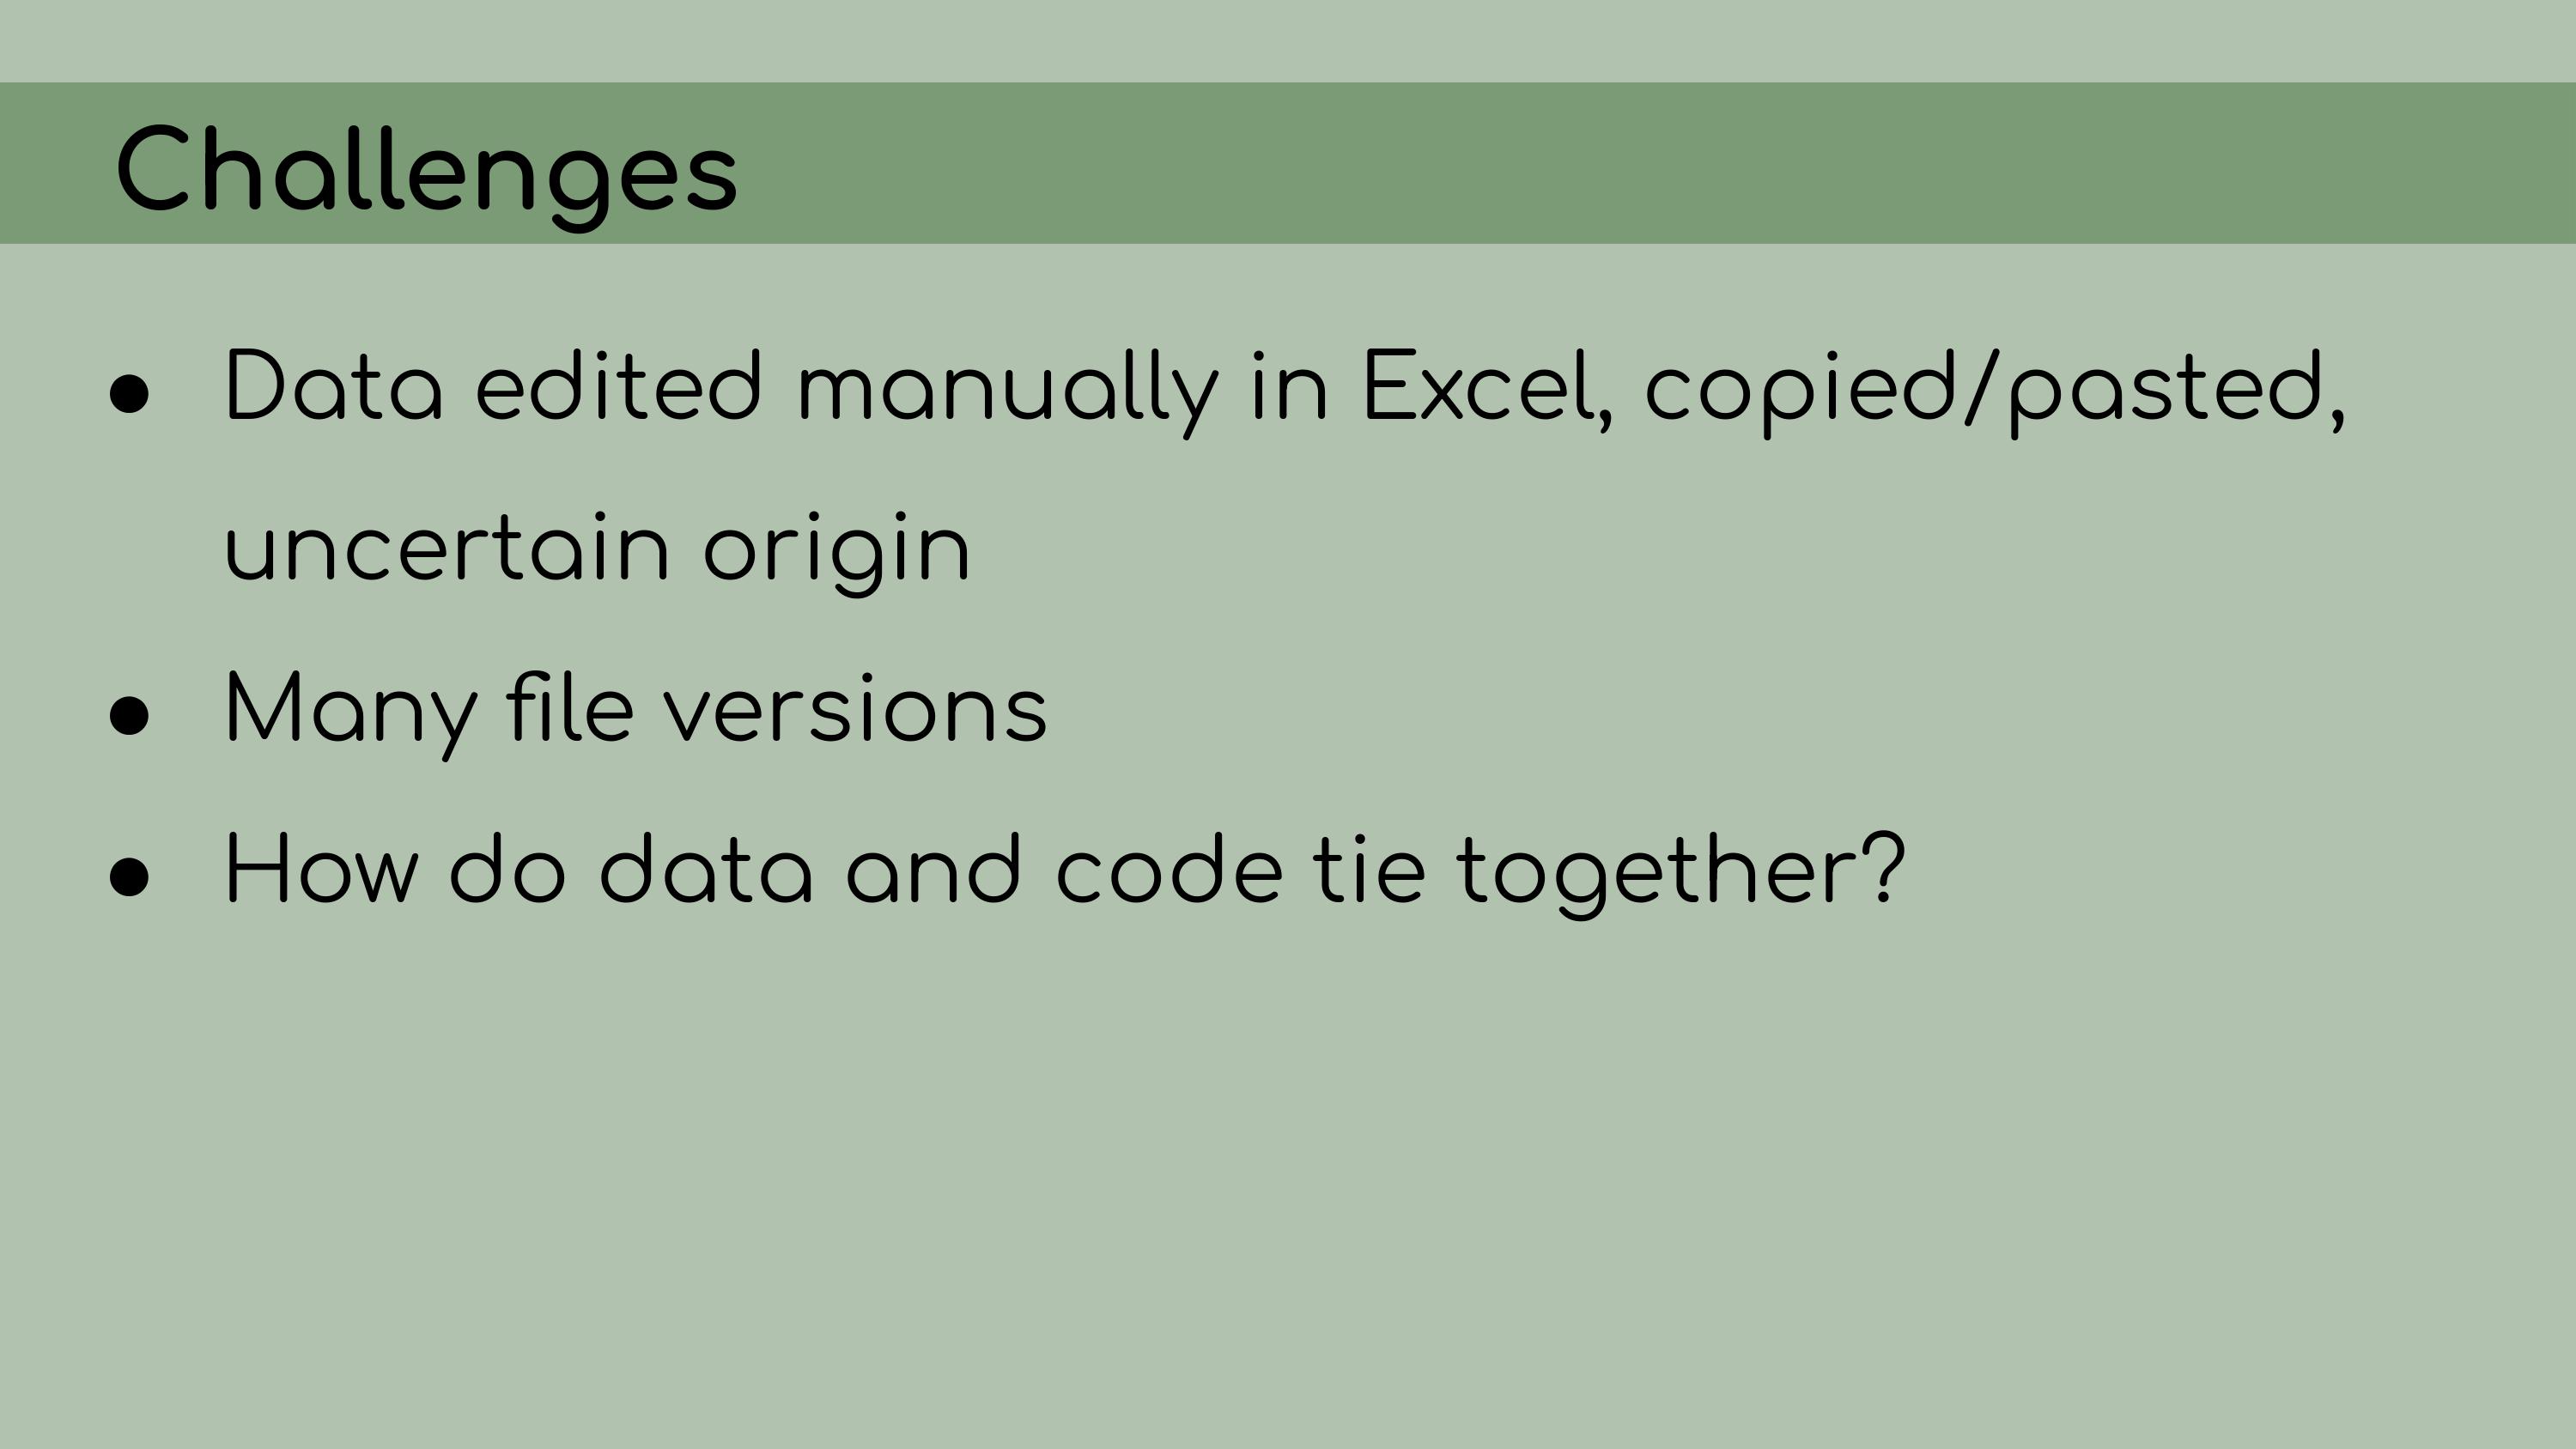 I think GitHub is a very important
tool, not just technically, for version control, but also
psychologically. If everything was being version controlled, then I
would have the power to edit and delete without being burdened by the
idea that I might be deleting something very important. I knew that as
long as everything was on GitHub, I could always walk the repository
back to its original version.
I think GitHub is a very important
tool, not just technically, for version control, but also
psychologically. If everything was being version controlled, then I
would have the power to edit and delete without being burdened by the
idea that I might be deleting something very important. I knew that as
long as everything was on GitHub, I could always walk the repository
back to its original version. My first step in organizing this repository
was to set it up as an RStudio Project, which means that it would open a
fresh R session for everyone who downloaded the code, and all file paths
could be written relative to the root directory.
My first step in organizing this repository
was to set it up as an RStudio Project, which means that it would open a
fresh R session for everyone who downloaded the code, and all file paths
could be written relative to the root directory.
I also
implemented renv, which is a great package that allows for
managing package versions. This was particularly important in the case
of this analysis, because some of the code depended on an old version of
the geomorph package for analyzing morphometric landmarks.
I personally wasn’t very familiar with the package, so even if I had
wanted to update the code to the newest version, I wouldn’t really have
been able to. Using renv allowed me to run the code with
the old version of the package, and it ensures that anyone who wants to
run our analysis in the future will be able to restore the packages from
the lockfile and immediately proceed without affecting packages on their
own computer. My next
step was to organize the data.
My next
step was to organize the data.
The first principle is that raw
data is sacred and should not be modified. So that means no copying and
pasting.
Derived data should then be fully reproducible and, by
extension, disposable. I should be able to just delete all of the
derived data, and then recreate it by re-running the scripts in the
pipeline.
Now, that might be a bit of a pain because some of the
analyses might take a long time to run, but it would be possible in a
fully reproducible analysis.
And my job approaching this project
was to distinguish between data that was raw––like maybe it was created
manually or it was exported from a program somewhere else––versus data
that could be regenerated from the analysis code.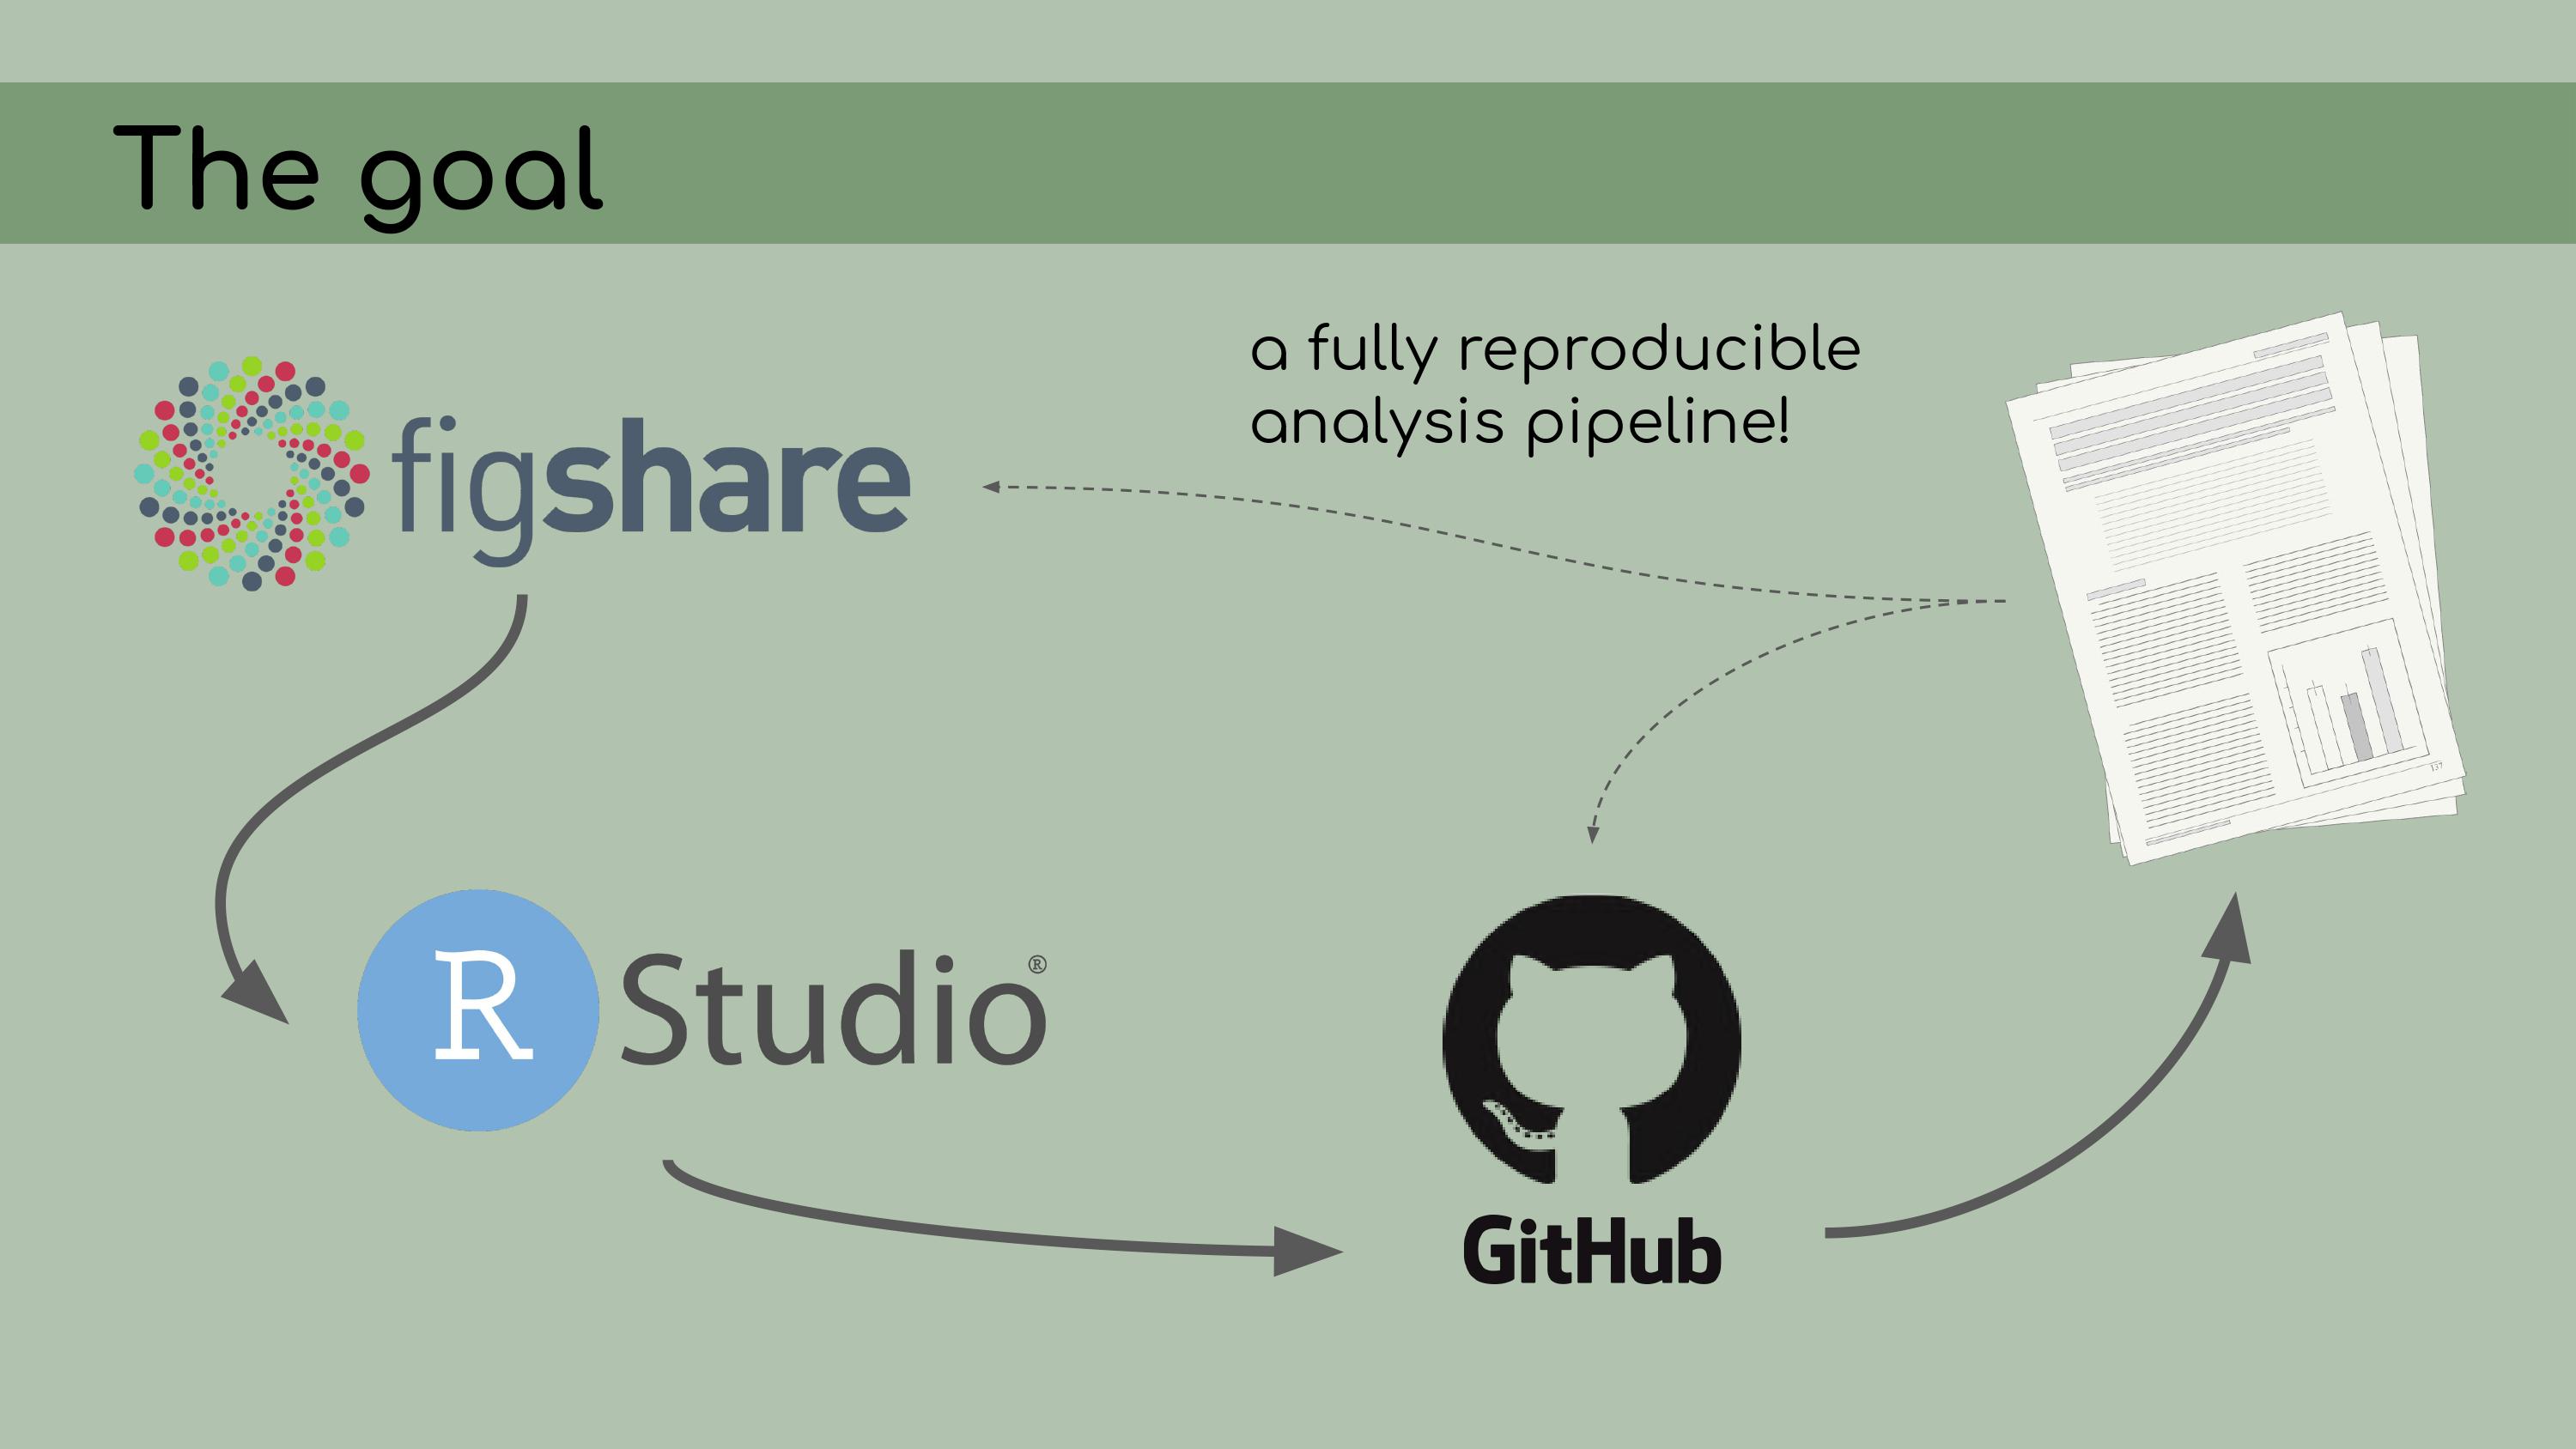 This is a list of all the data files that I
was originally presented with in the GitHub repository, and it was
pretty overwhelming. I had to sort through all of those and figure out
which were raw, which were derived, and where they all went in the
pipeline.
This is a list of all the data files that I
was originally presented with in the GitHub repository, and it was
pretty overwhelming. I had to sort through all of those and figure out
which were raw, which were derived, and where they all went in the
pipeline. And in order
to do this, I asked the key question, ‘Where did this come from?’ For
each file, I wanted to know, how was it generated? Can I trace the
origin of all the files and their columns?
And in order
to do this, I asked the key question, ‘Where did this come from?’ For
each file, I wanted to know, how was it generated? Can I trace the
origin of all the files and their columns?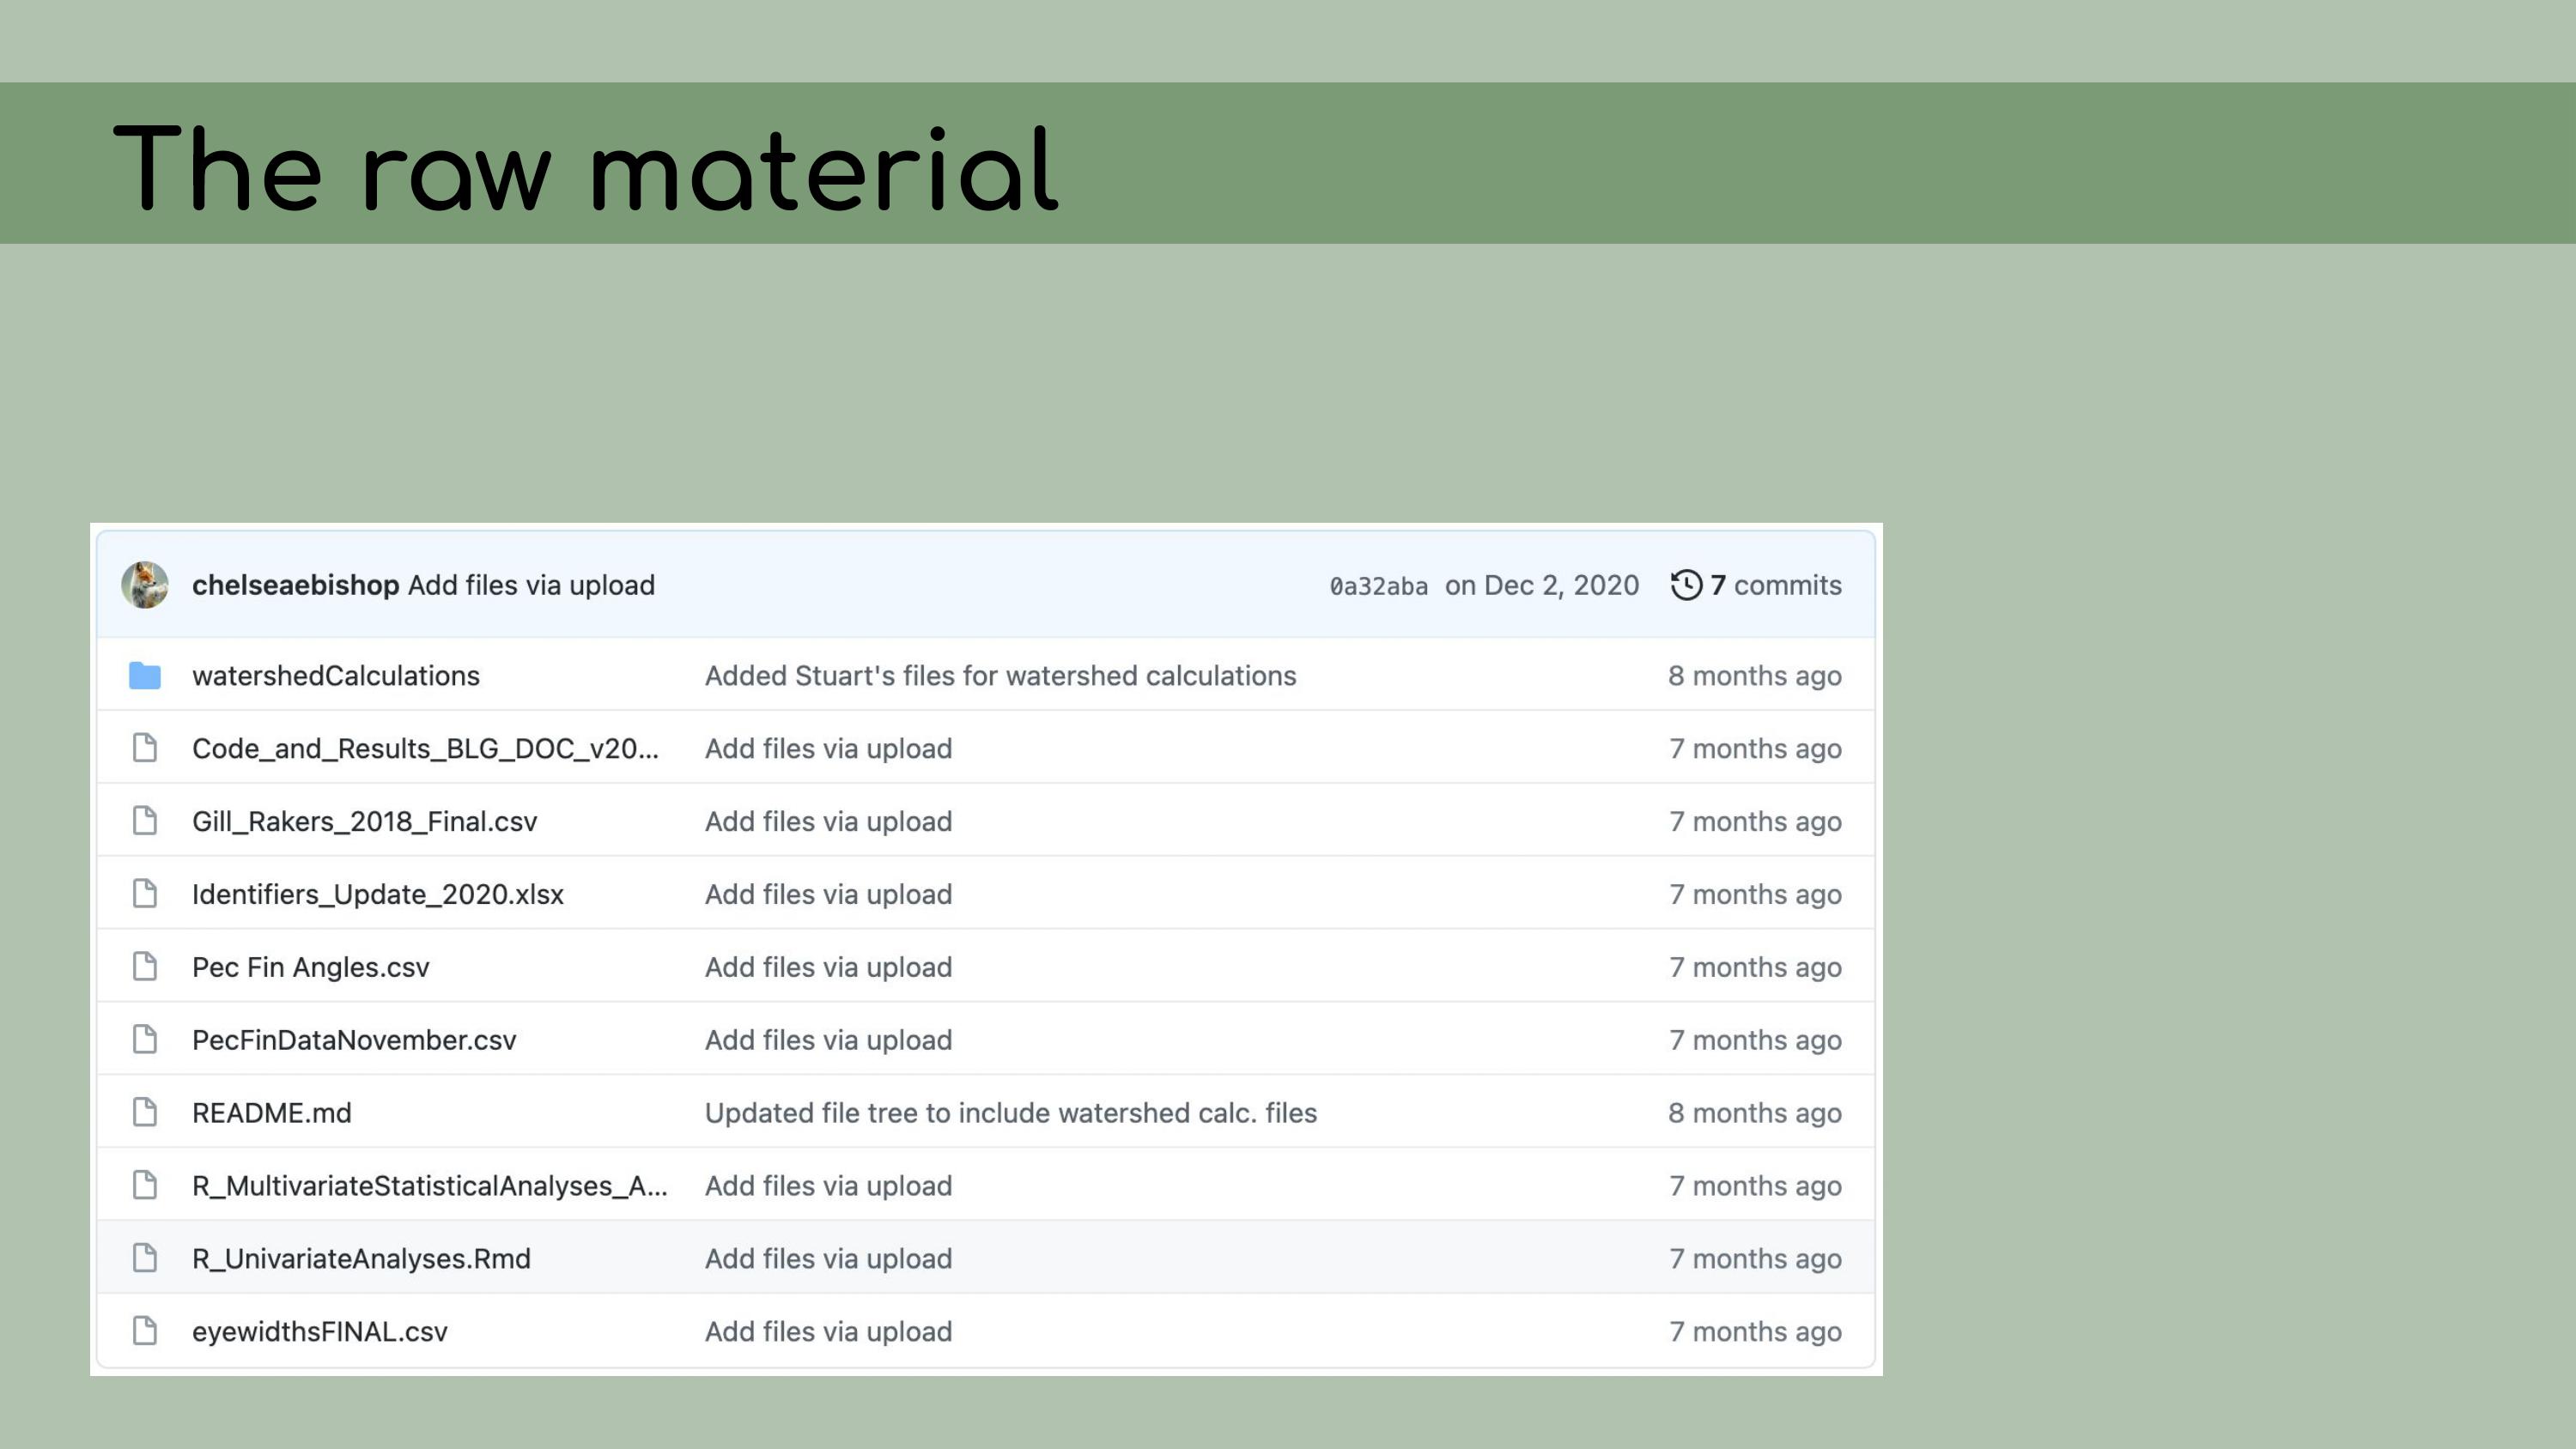 I started out by making a spreadsheet
listing out each file, and this seemed like a good idea at the time, but
it ended up being pretty overwhelming, and it was hard for Chelsea to go
through and answer my questions, especially because I was attacking all
the files at once, without regard for their importance or the order that
they might go in. I was just trying to get my head around
it.
I started out by making a spreadsheet
listing out each file, and this seemed like a good idea at the time, but
it ended up being pretty overwhelming, and it was hard for Chelsea to go
through and answer my questions, especially because I was attacking all
the files at once, without regard for their importance or the order that
they might go in. I was just trying to get my head around
it.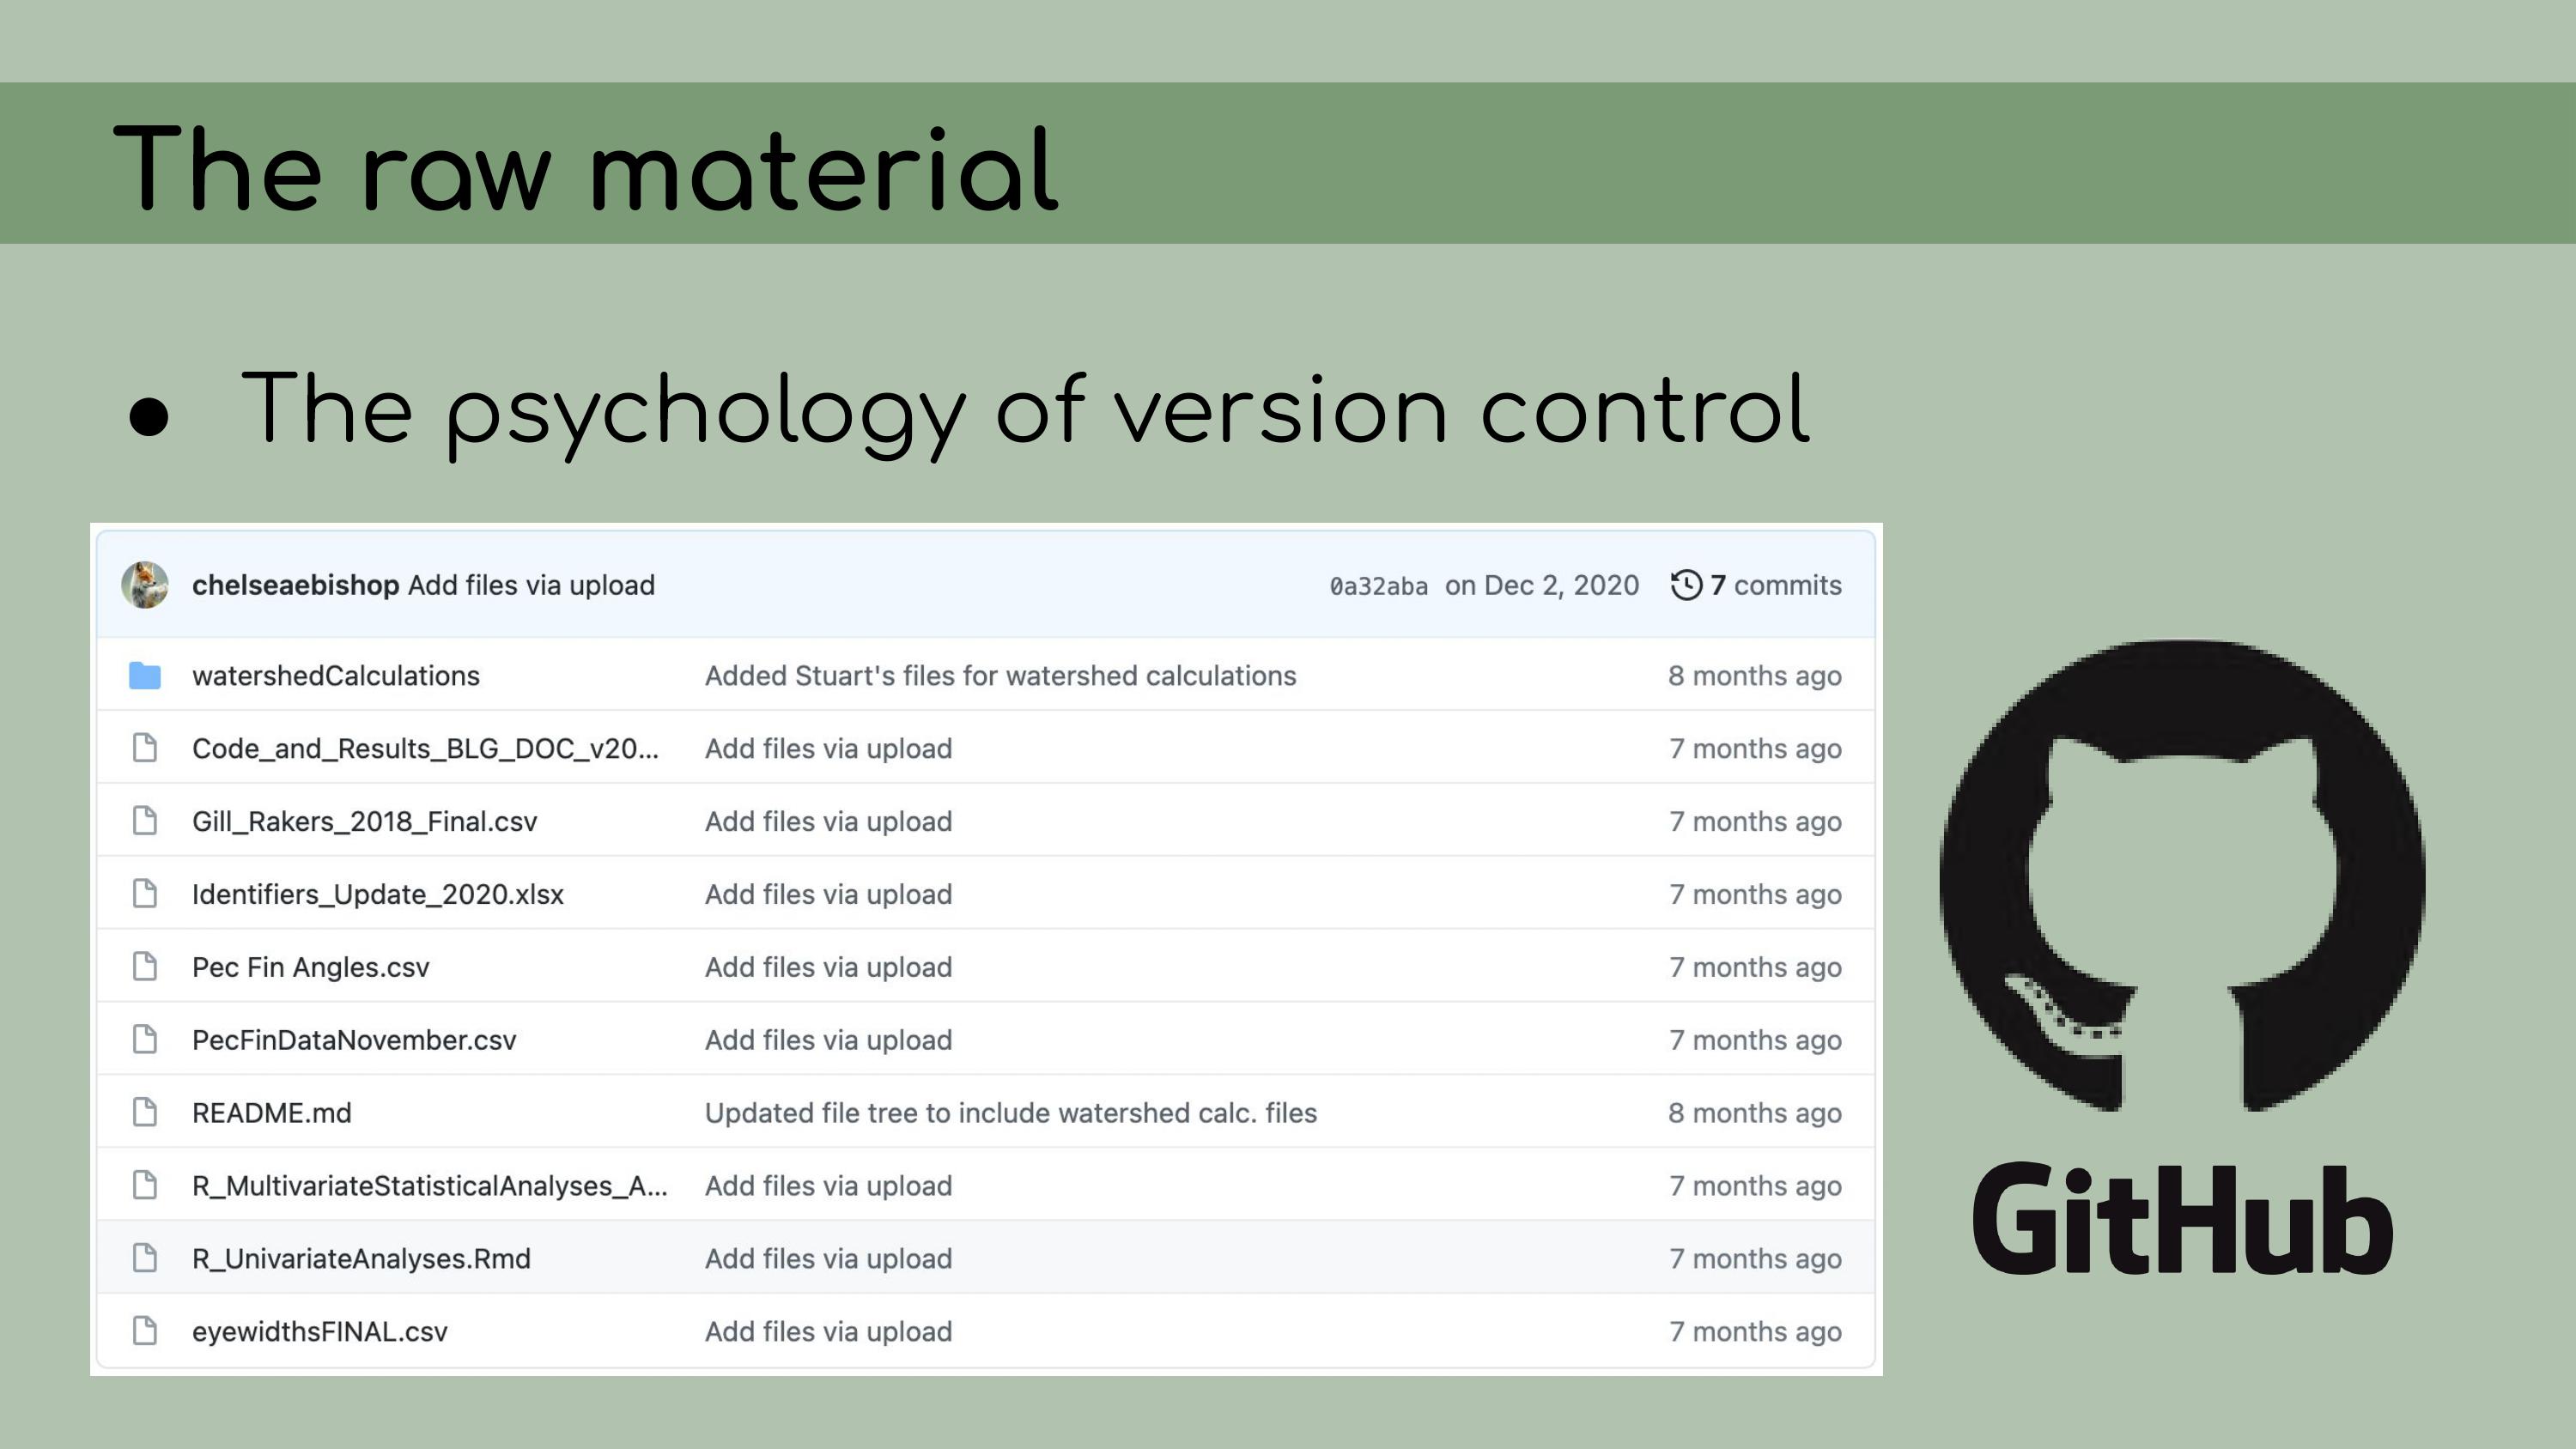 Chelsea and I
decided that a better approach would be to start with the most recent
and up-to-date analysis file; in our case, called
ReviewApril2020.
Chelsea and I
decided that a better approach would be to start with the most recent
and up-to-date analysis file; in our case, called
ReviewApril2020. Then, I
could look at all of the data files that were read in as inputs. It was
much easier, with this reduced set of files, to
determine…
Then, I
could look at all of the data files that were read in as inputs. It was
much easier, with this reduced set of files, to
determine…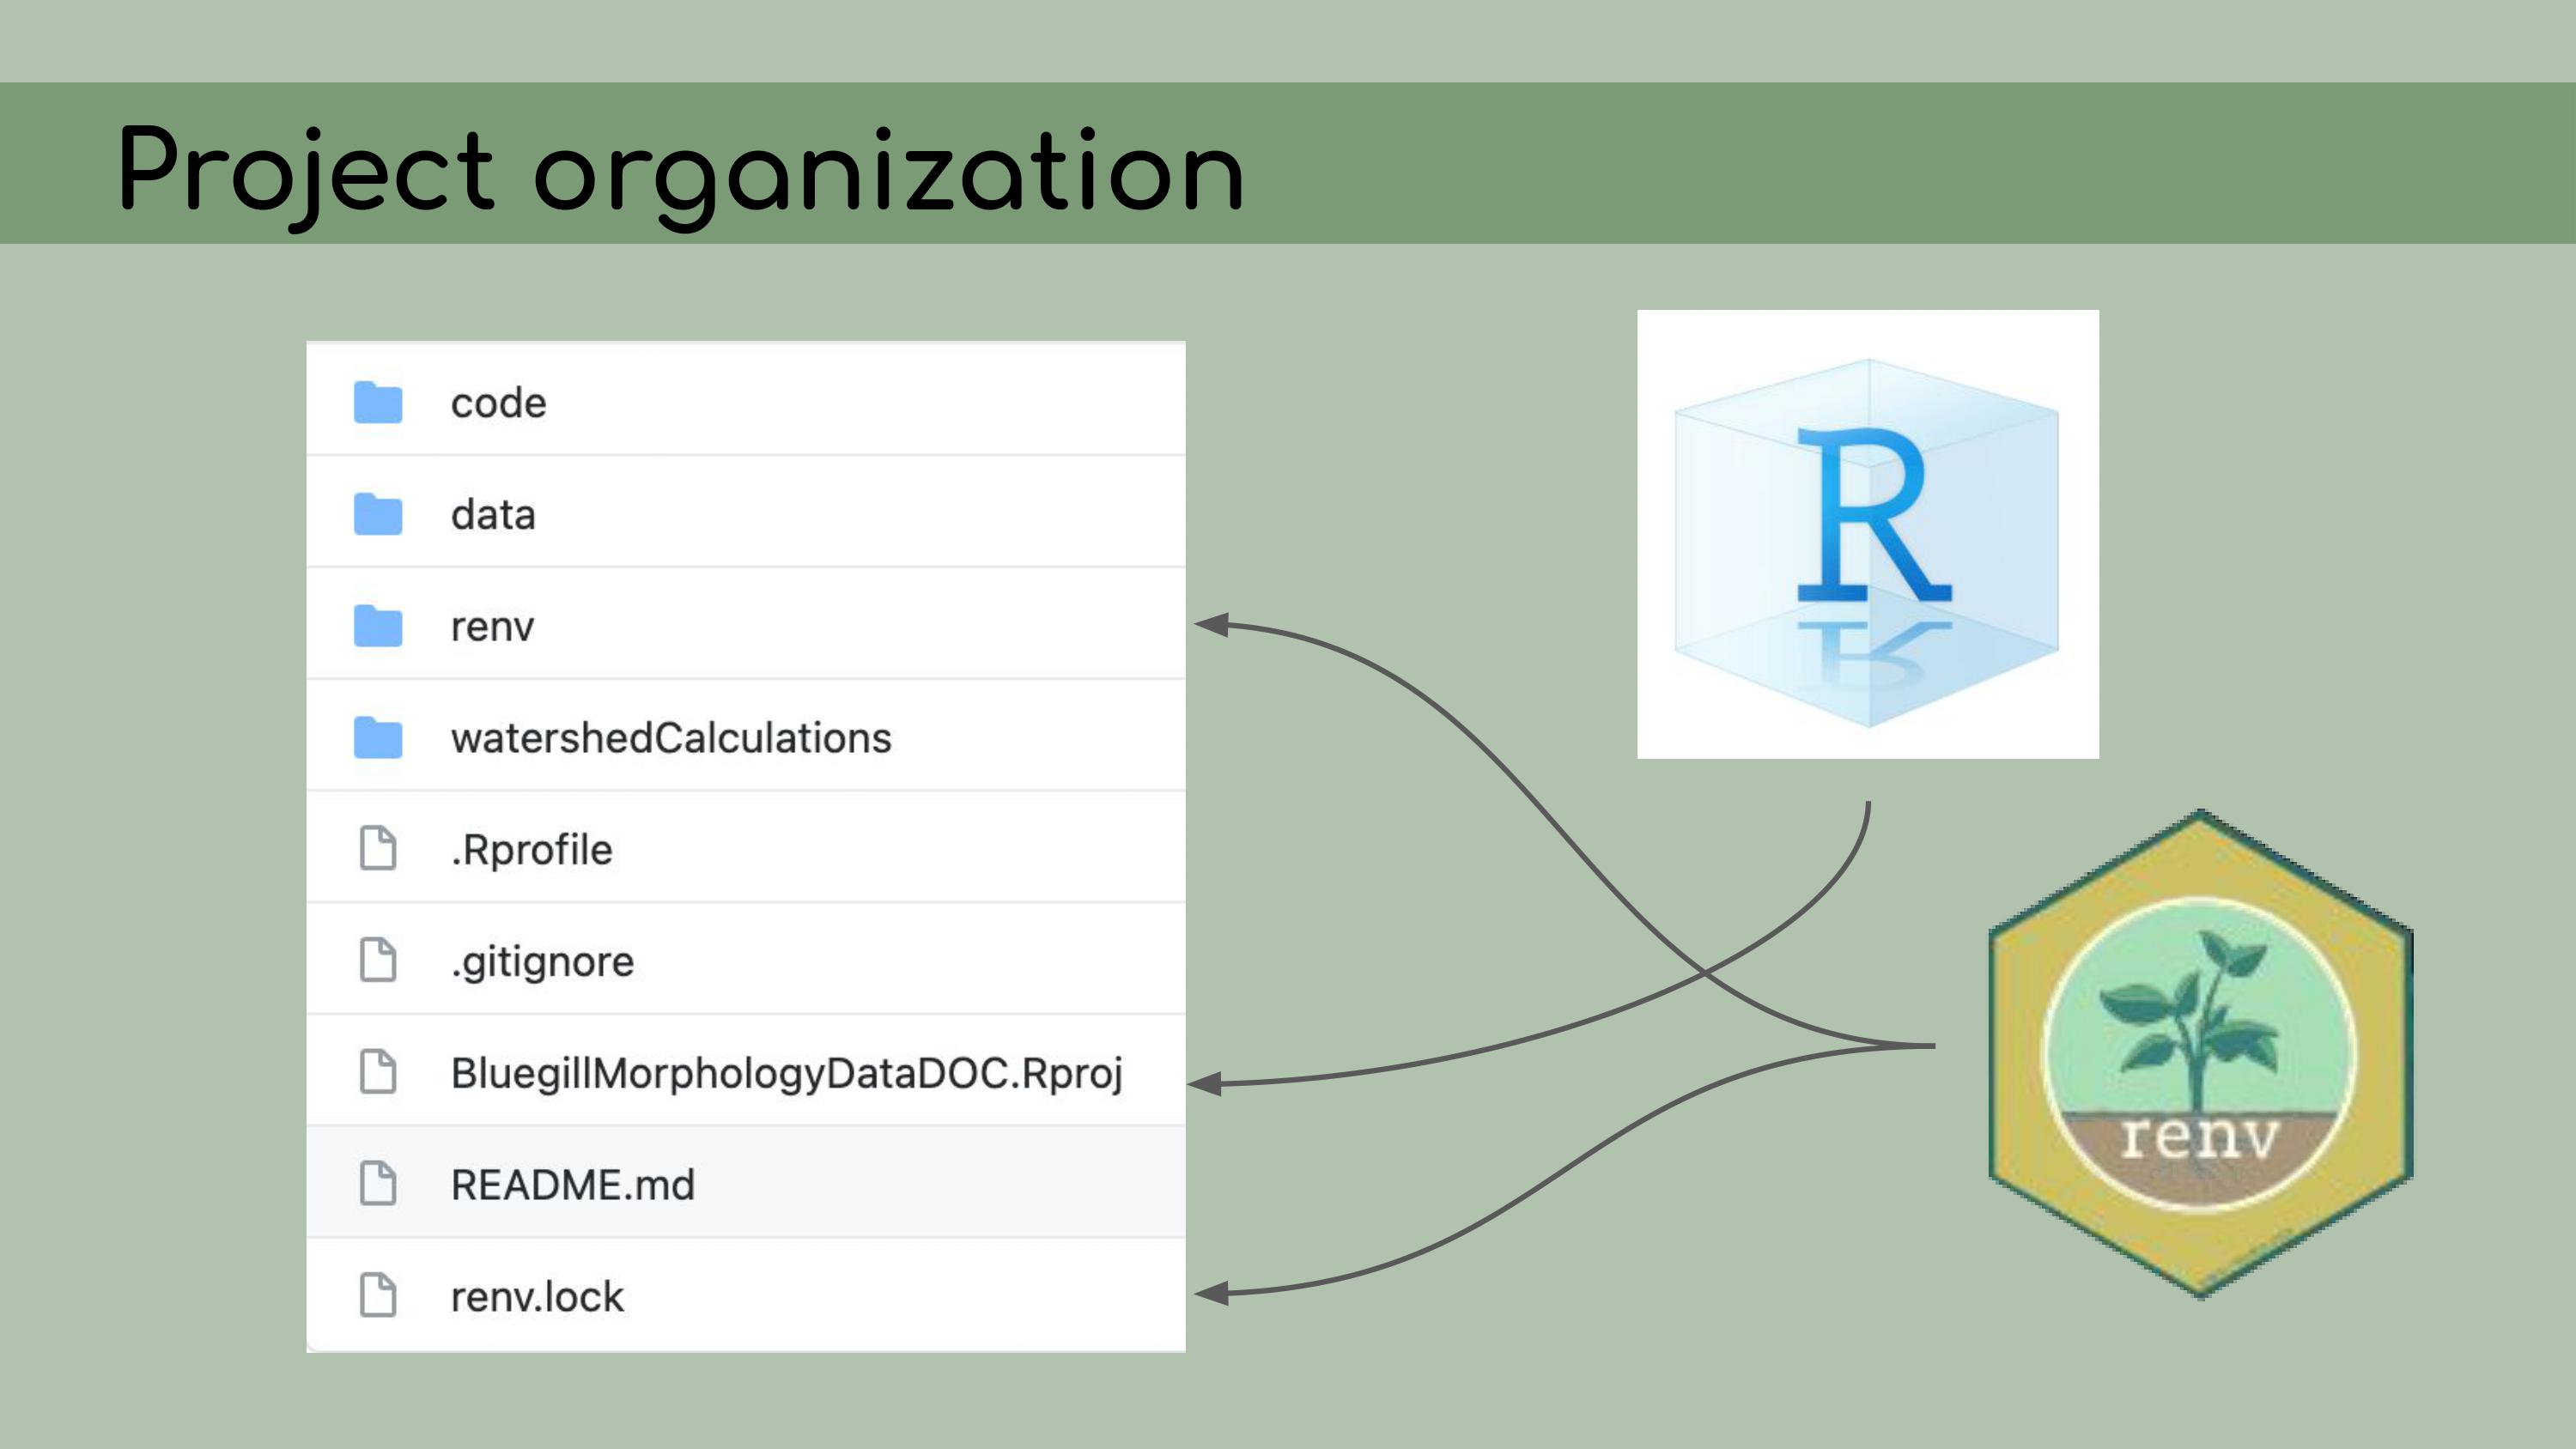 …which ones
were raw data and which ones were derived data. So, my next step was,
for each of those derived data files, to figure out how to re-create it
from the data in the database, using R scripts, so that the process
would be fully reproducible.
…which ones
were raw data and which ones were derived data. So, my next step was,
for each of those derived data files, to figure out how to re-create it
from the data in the database, using R scripts, so that the process
would be fully reproducible. To do that, I created one R script for each
of the derived data files, and I used that R script to read in data from
the database stored on Figshare and modify it to generate these ‘FINAL’
csv files. In the background, I kept the original data and used it as a
comparison, just to make sure I was accurately recreating that original
data.
To do that, I created one R script for each
of the derived data files, and I used that R script to read in data from
the database stored on Figshare and modify it to generate these ‘FINAL’
csv files. In the background, I kept the original data and used it as a
comparison, just to make sure I was accurately recreating that original
data.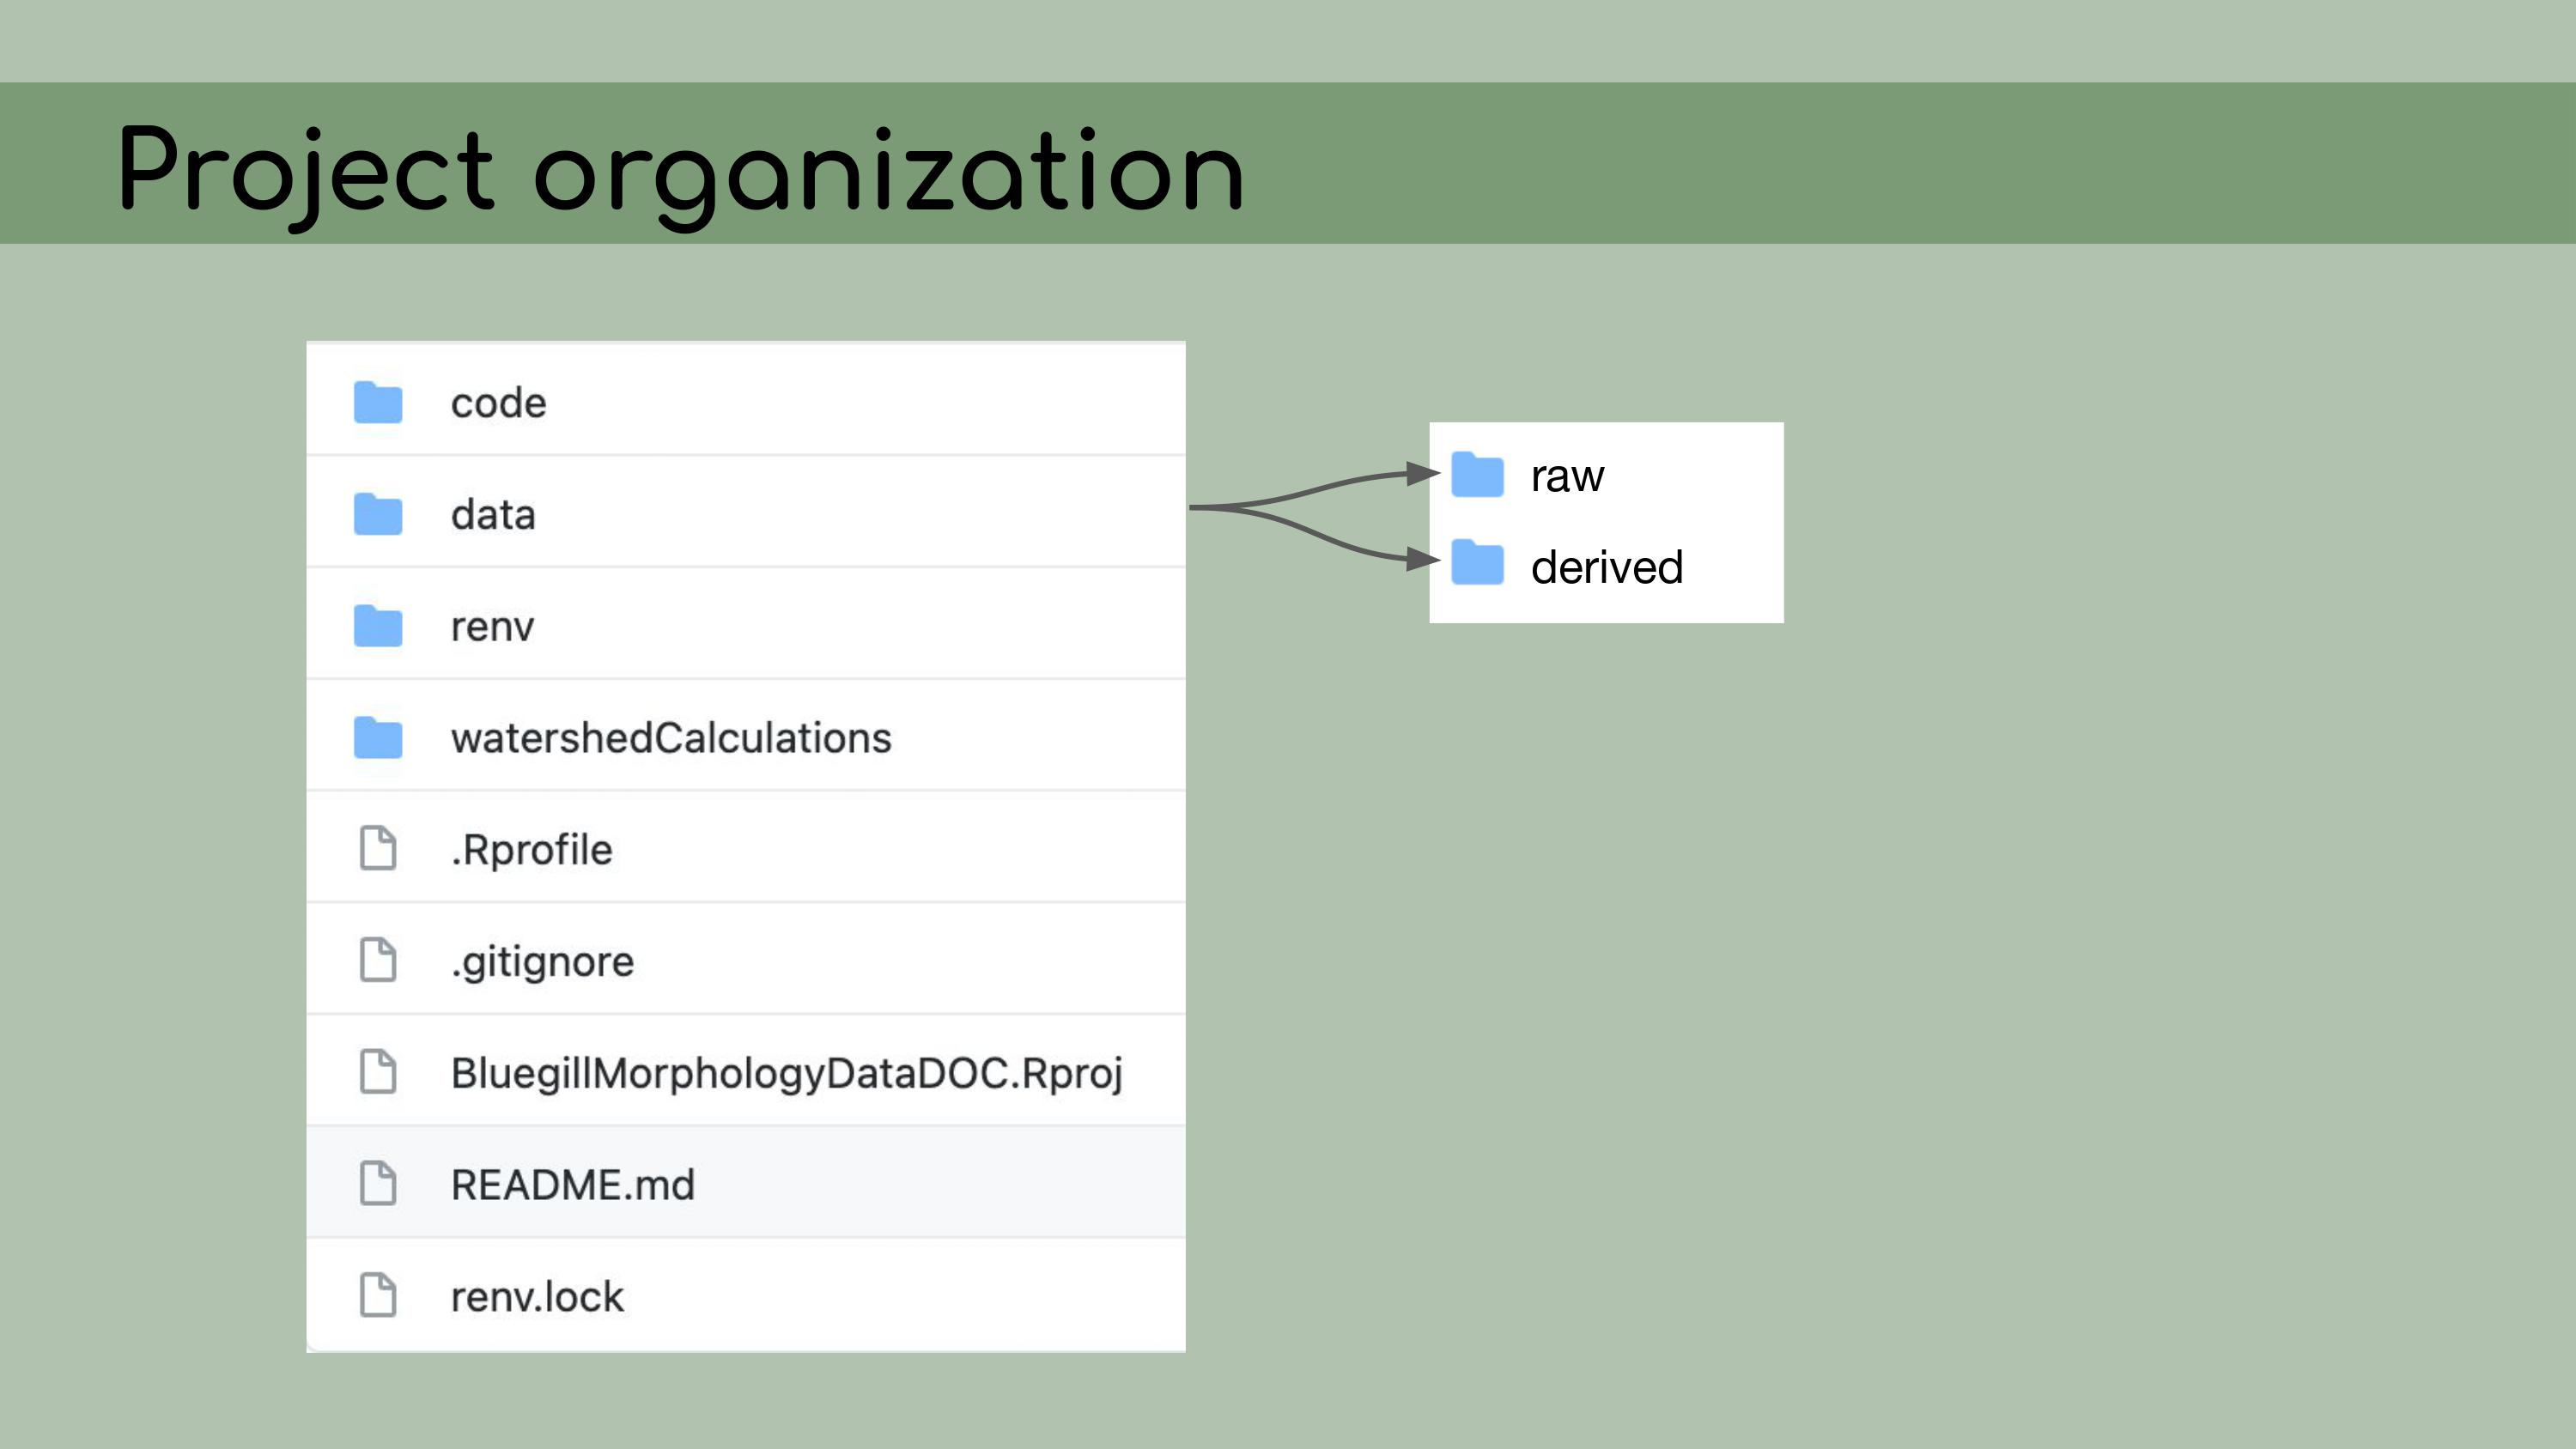 My next step was
to organize the code in the analysis files. I had to start by
reorganizing a lot of file paths; they had been written as absolute
paths, and I rewrote them as relative paths using the wonderful
My next step was
to organize the code in the analysis files. I had to start by
reorganizing a lot of file paths; they had been written as absolute
paths, and I rewrote them as relative paths using the wonderful
here package. I clarified a lot of the code by renaming
the variables with descriptive names and adding clear
comments.
I clarified a lot of the code by renaming
the variables with descriptive names and adding clear
comments. I also
organized the code to make sure it was easy to read and
follow.
I also
organized the code to make sure it was easy to read and
follow.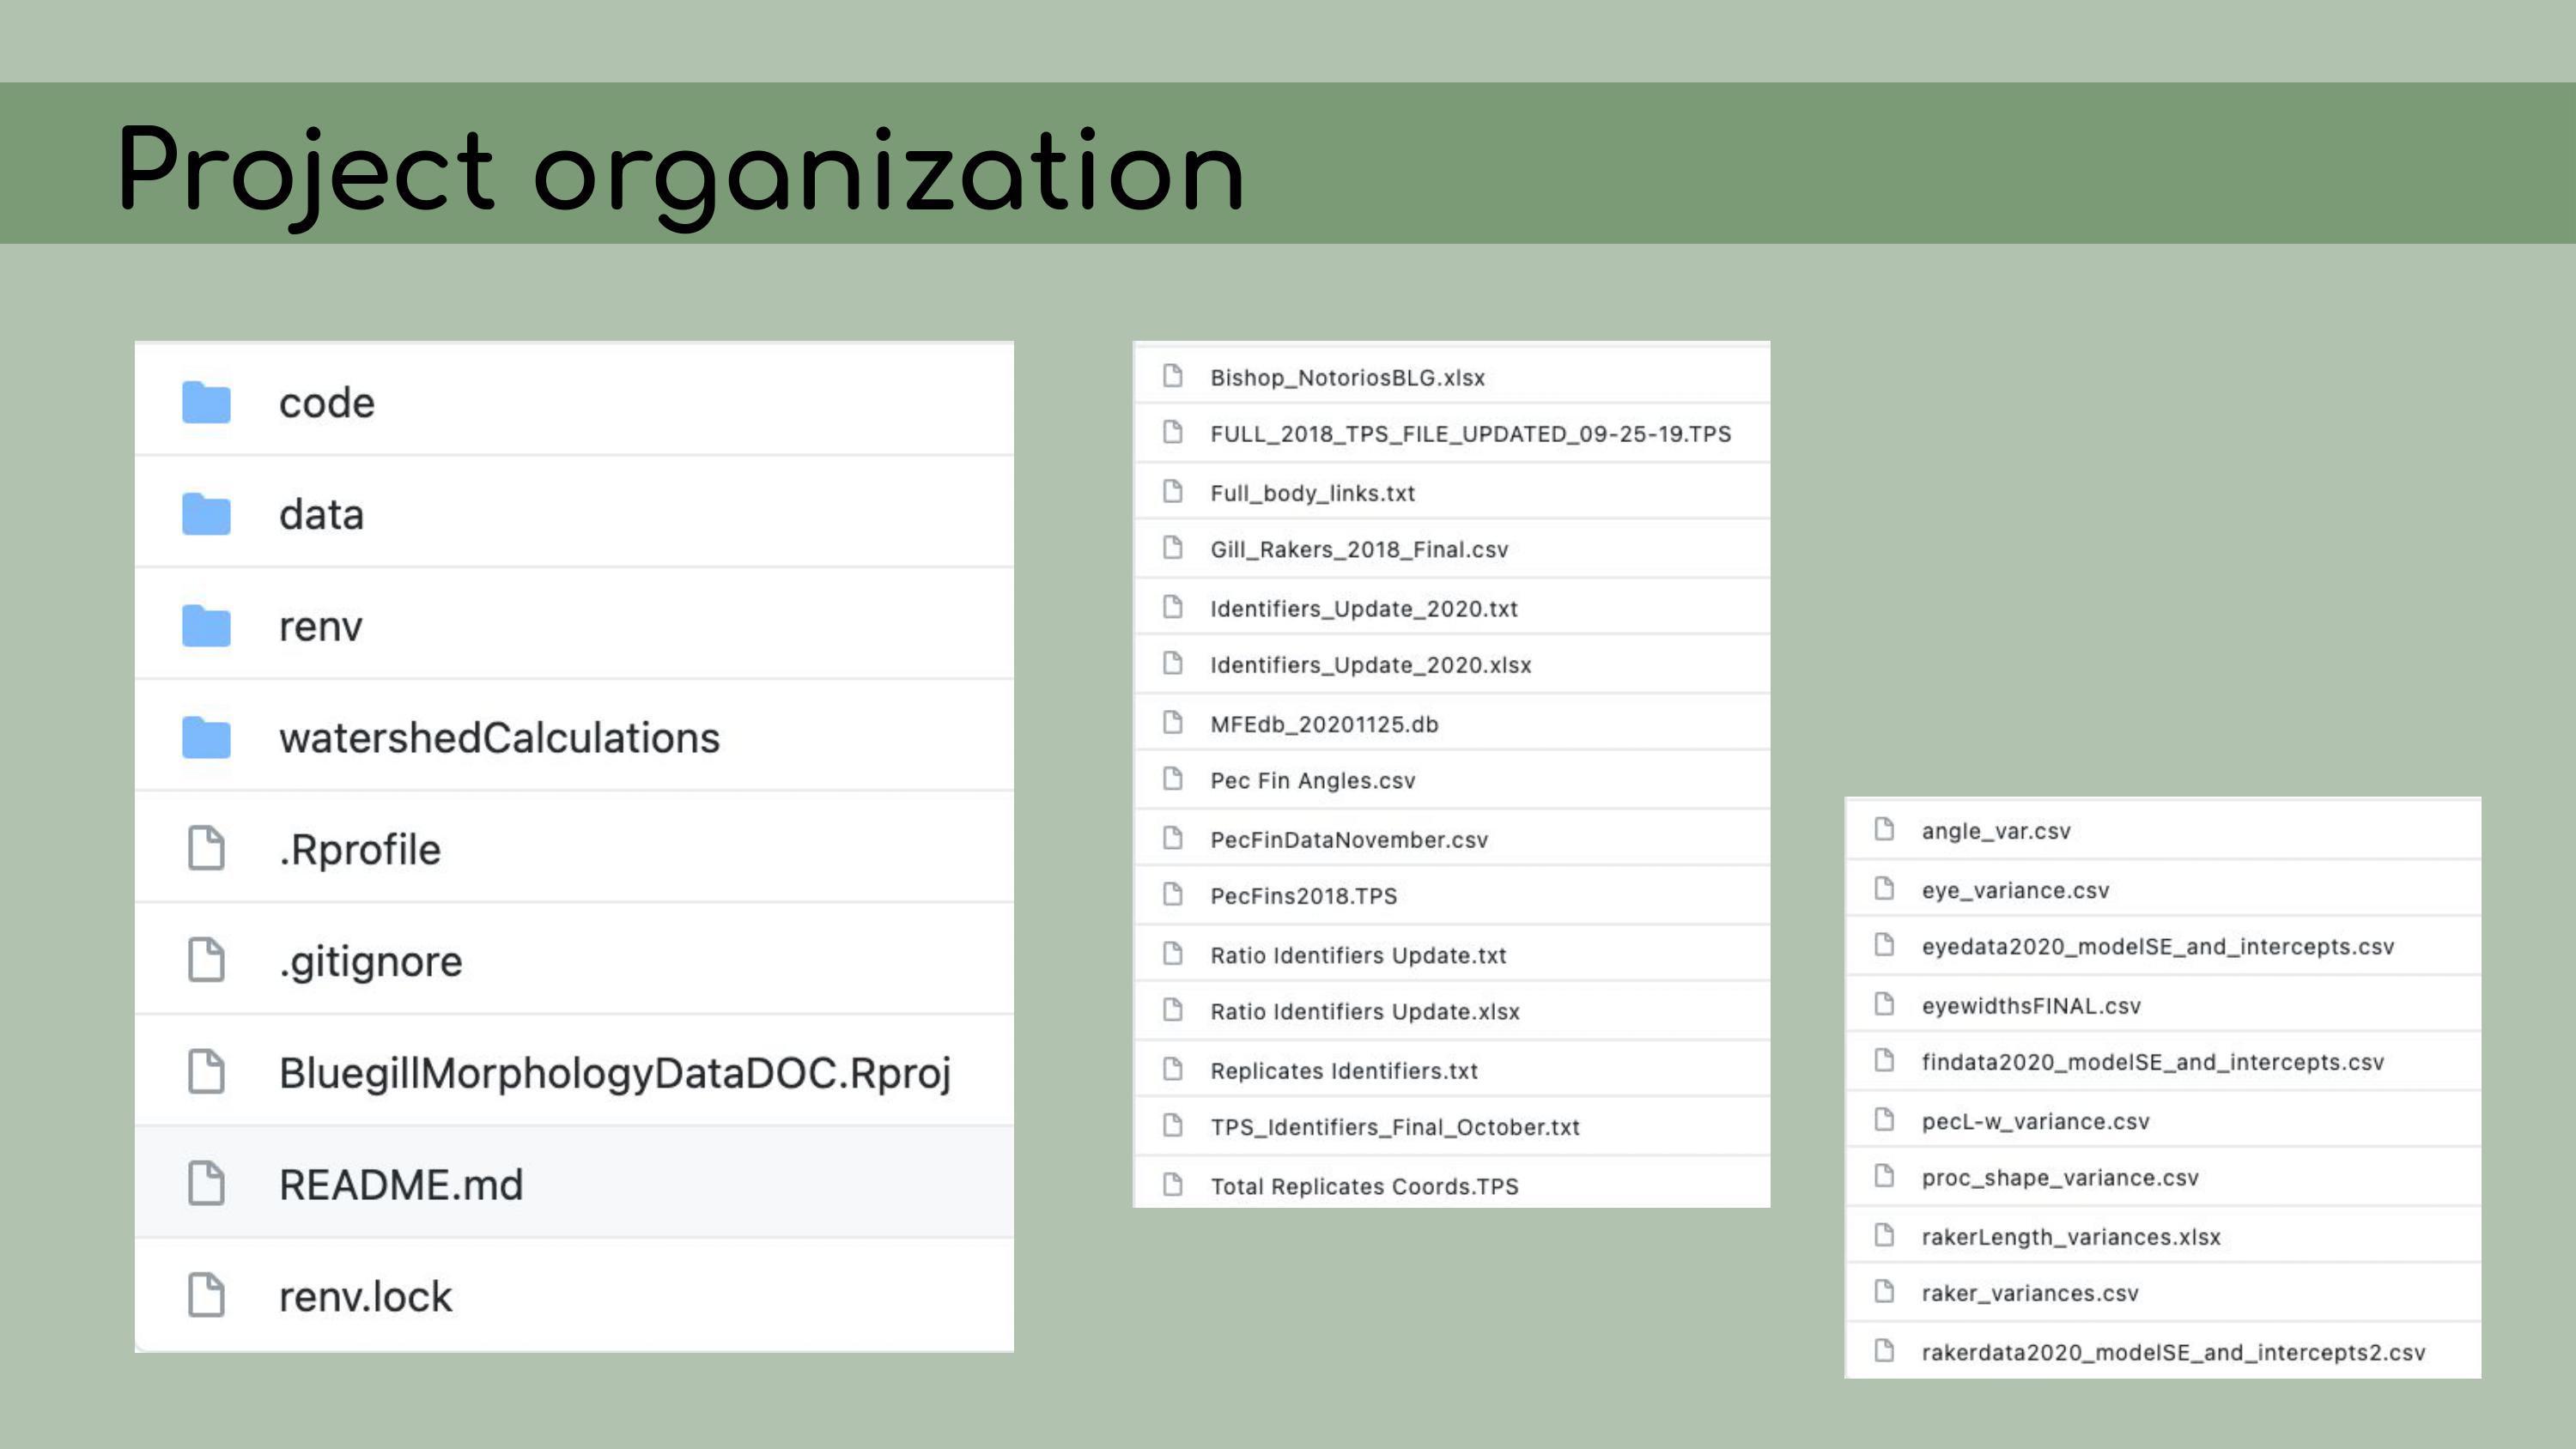 And to do that, I
made heavy use of the outline panel within RStudio, which you can access
by clicking on this sort of list icon at the top right corner of the
script pane.
And to do that, I
made heavy use of the outline panel within RStudio, which you can access
by clicking on this sort of list icon at the top right corner of the
script pane.
You’ll notice that this ‘Load packages’ header
corresponds to a line in this document outline, and that actually
happens automatically within RStudio.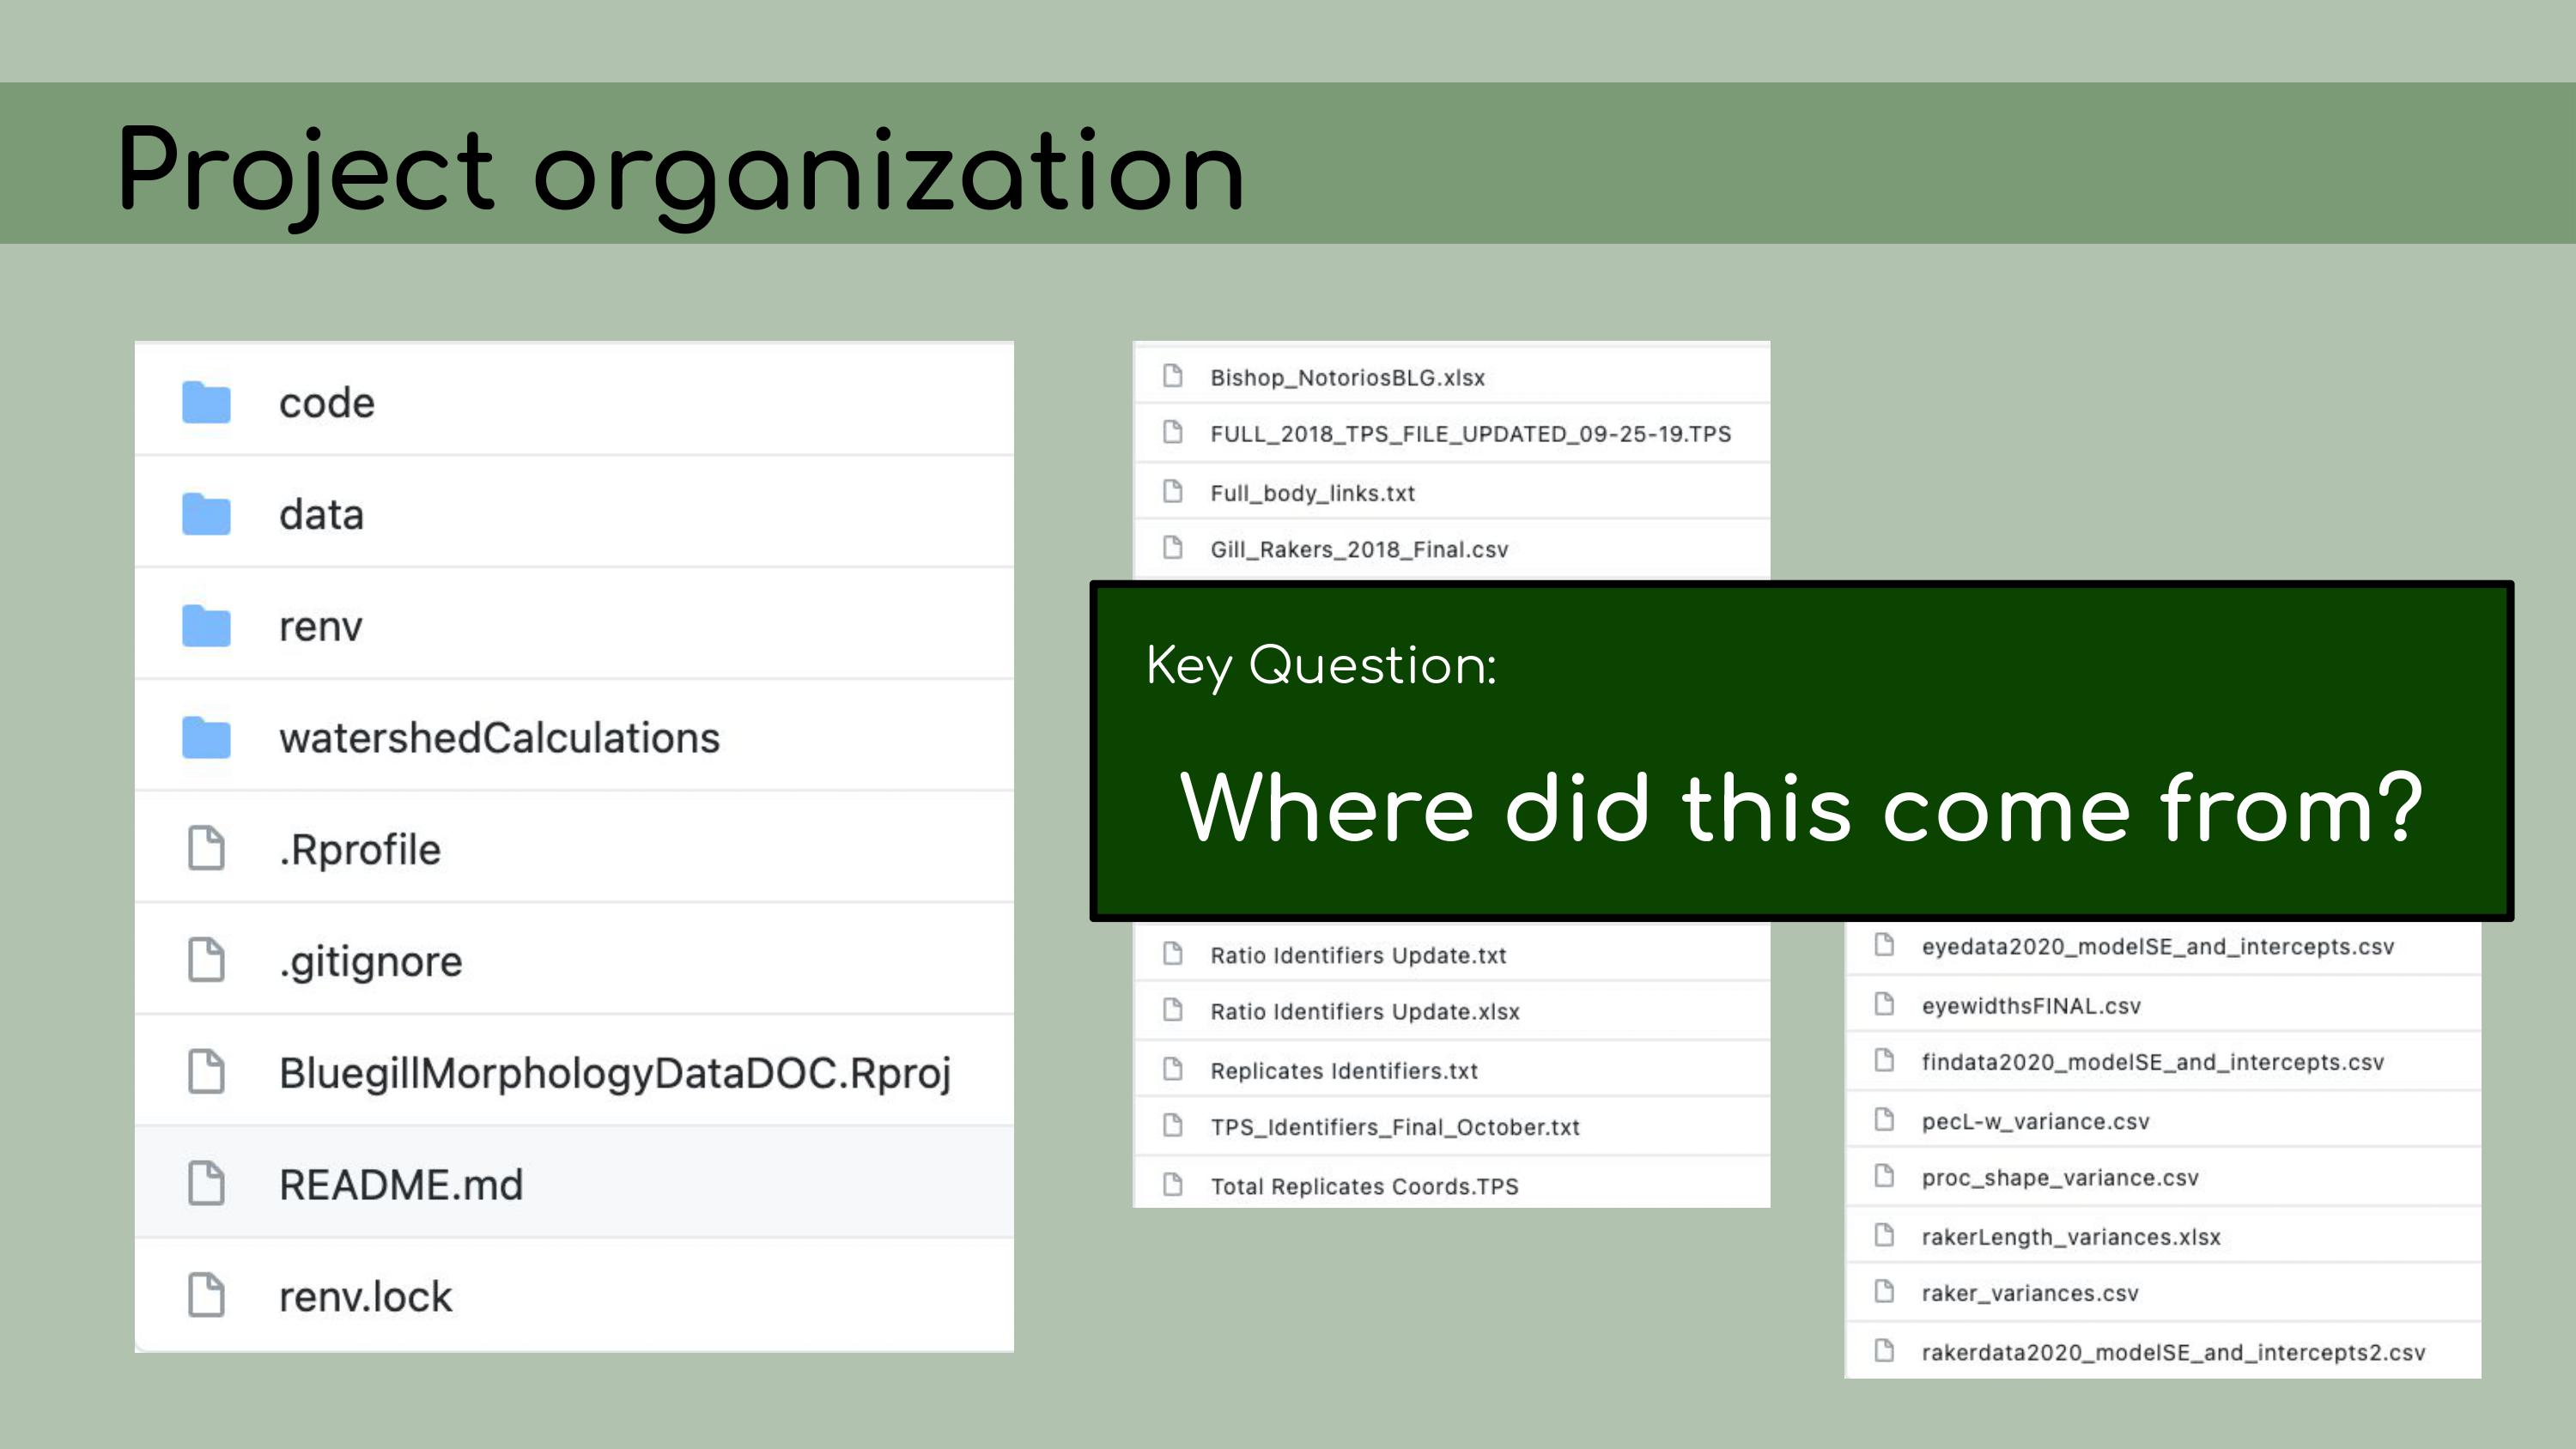 You can create these header lines by
clicking Command + Shift + R on a Mac, and they automatically get added
to the outlines.
You can create these header lines by
clicking Command + Shift + R on a Mac, and they automatically get added
to the outlines.
And then you can also see that I have a lot of
packages loaded at the top here, a lot of comments, and everything is
just a little bit cleaner and easier to read. I wrote a README to document this project,
including an abstract to introduce people to the project, instructions
for how to download the data from Figshare and how to run the project,
restoring all the packages from the
I wrote a README to document this project,
including an abstract to introduce people to the project, instructions
for how to download the data from Figshare and how to run the project,
restoring all the packages from the renv lock file, and
also information about the contributors. Finally, I wanted to emphasize that I
had to go over the same scripts multiple times, and sometimes doing a
first cleanup of the code helped me realize that reorganizing the code
in different way would actually be clearer, and so I ended up doing what
felt like the same work twice. I think that that re-tidying––it
shouldn’t be dismissed as being inefficient or not doing it right the
first time, because in my case, I had to take a lot of time to just get
my head around how the code was organized before I could make informed
decisions about how to clean it up.
Finally, I wanted to emphasize that I
had to go over the same scripts multiple times, and sometimes doing a
first cleanup of the code helped me realize that reorganizing the code
in different way would actually be clearer, and so I ended up doing what
felt like the same work twice. I think that that re-tidying––it
shouldn’t be dismissed as being inefficient or not doing it right the
first time, because in my case, I had to take a lot of time to just get
my head around how the code was organized before I could make informed
decisions about how to clean it up.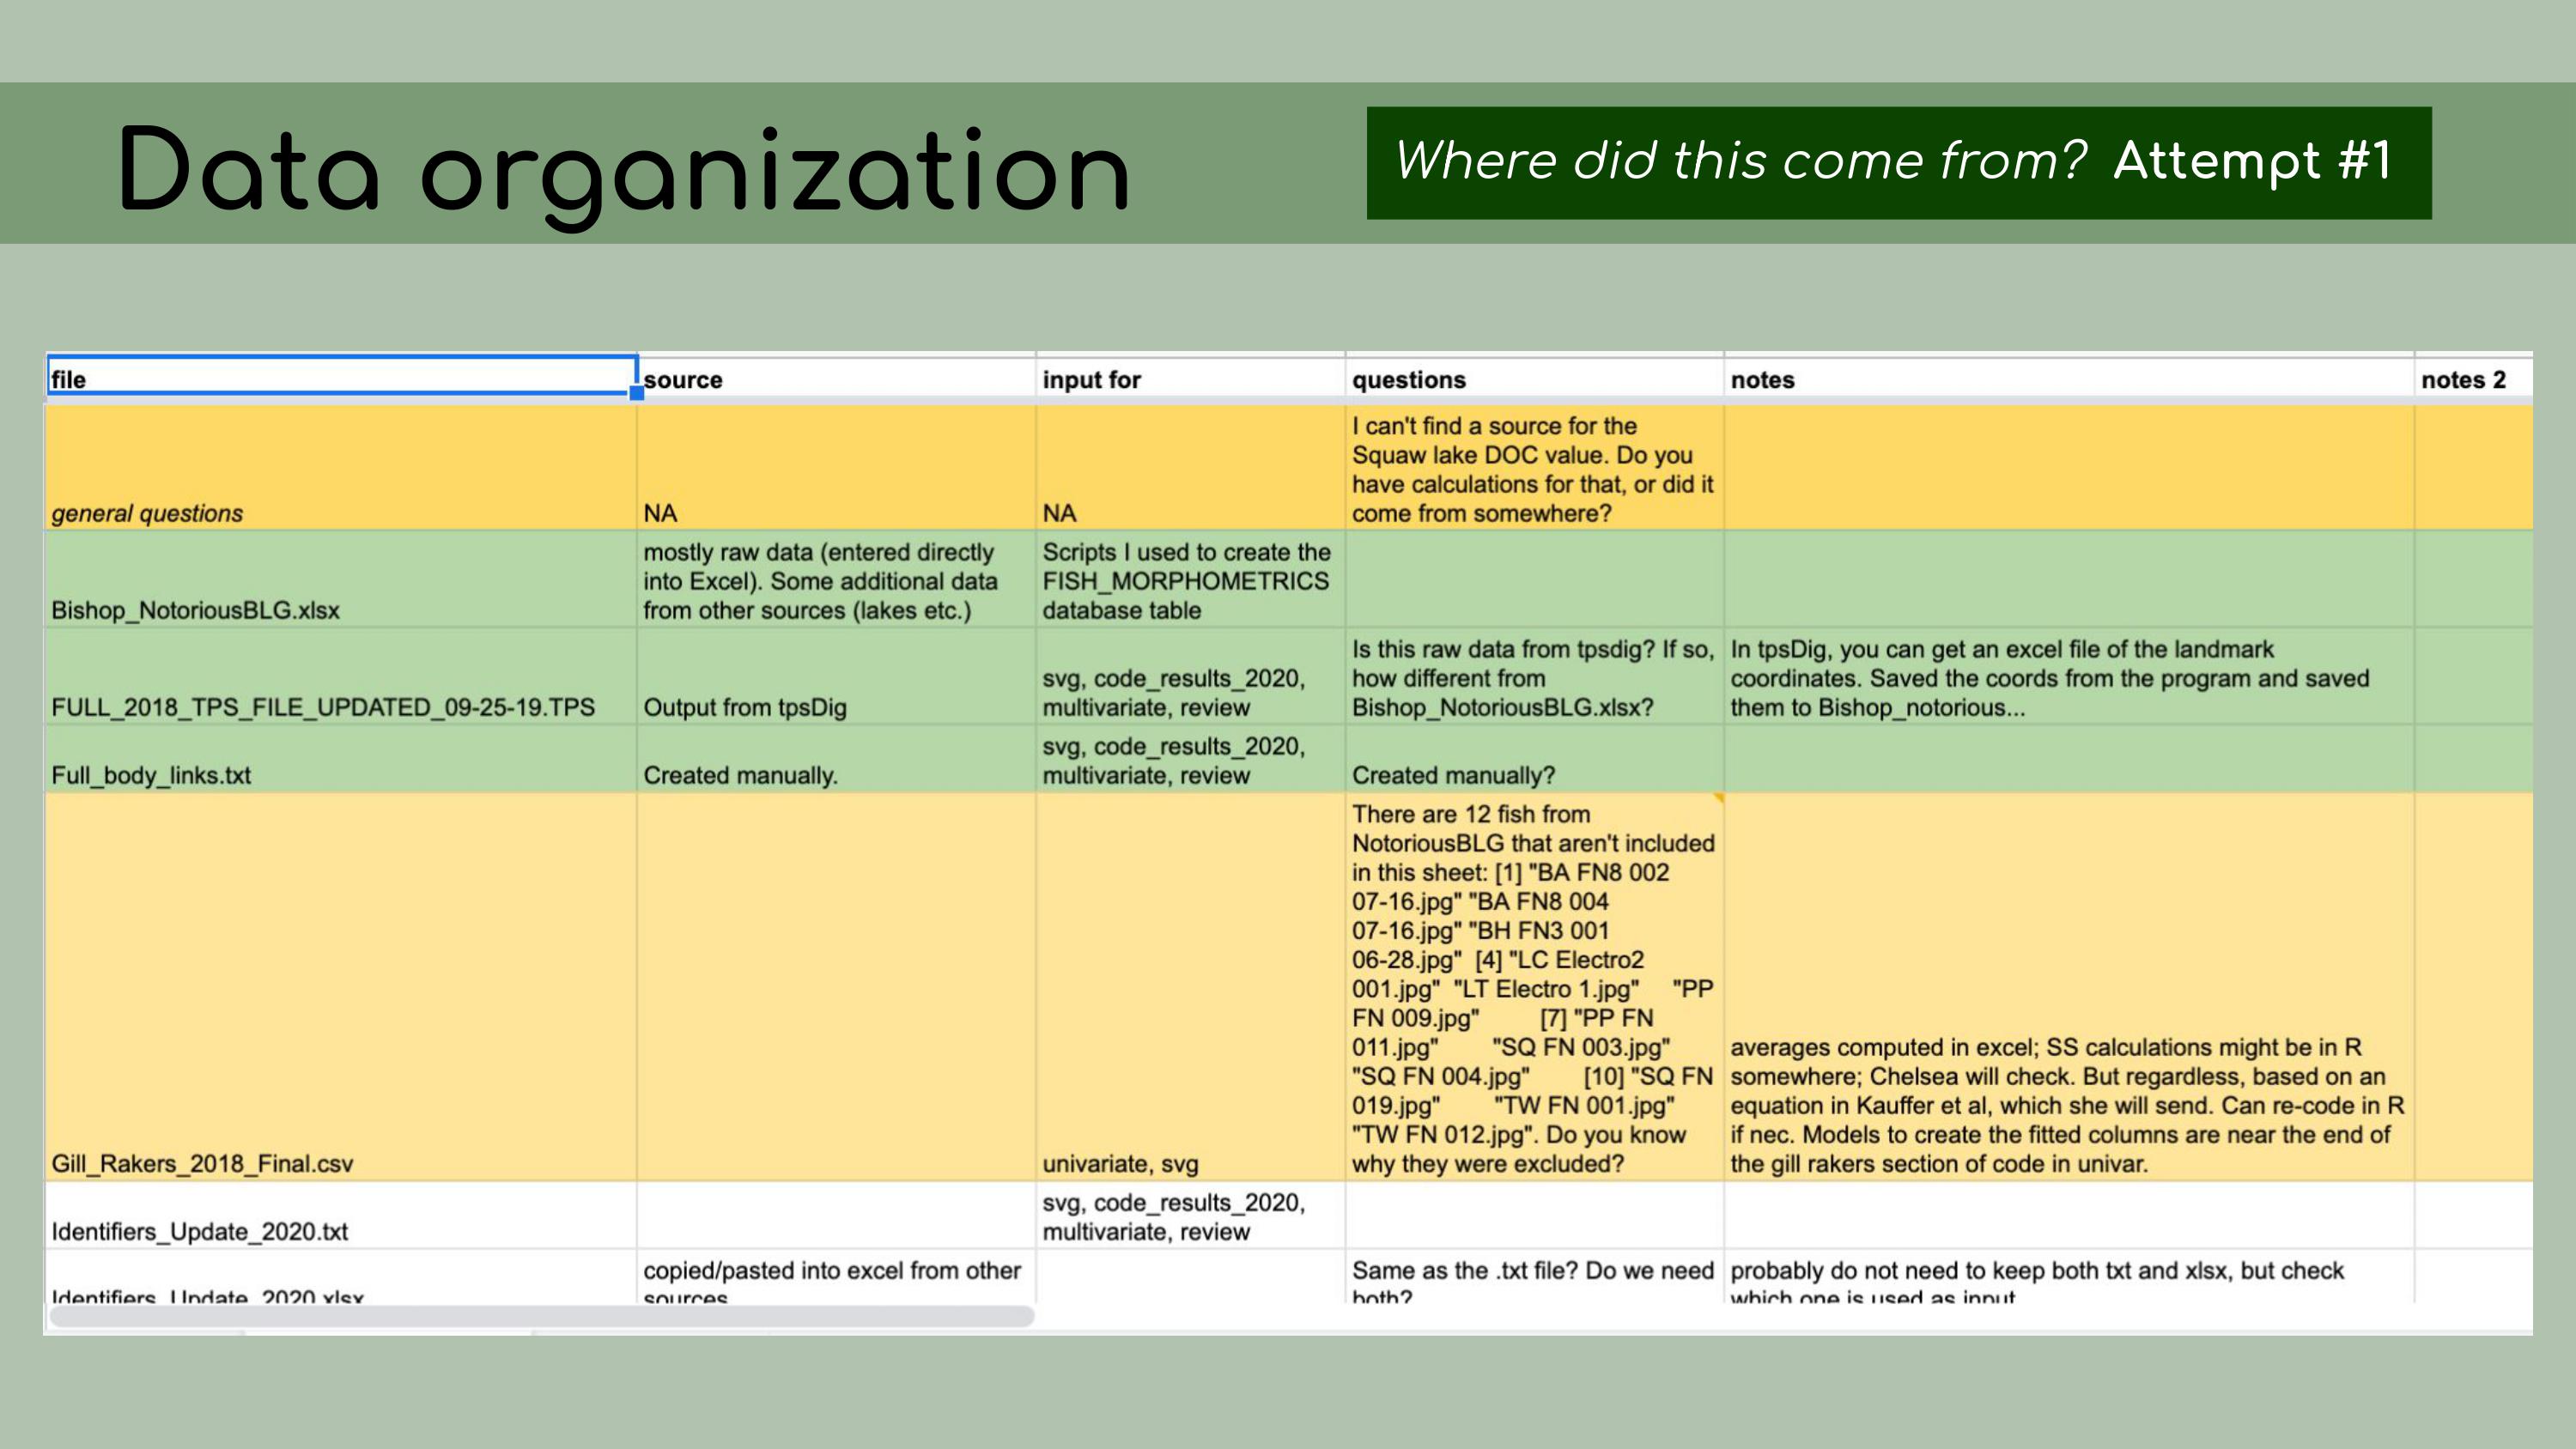 So, I’ve talked about a lot of tools that I
used in creating this reproducible pipeline, from Figshare to RStudio
and RStudio Projects, GitHub for version control, Google Drawings in my
case for creating this flowchart, and
So, I’ve talked about a lot of tools that I
used in creating this reproducible pipeline, from Figshare to RStudio
and RStudio Projects, GitHub for version control, Google Drawings in my
case for creating this flowchart, and renv for organizing
packages. And this might be overwhelming if you’ve never used these
tools before and it feels like you have a lot of things to learn if you
want to start implementing reproducible workflows.
But I want to
emphasize that there are smaller things that you can do to move in the
right direction, even if you can’t jump right into using best practices
from the get-go. For
example, don’t be afraid to tell stories with your comments. I like to
be very conversational; I like to say ‘Okay, now we’re going to do X’,
‘I noticed this about the output, and that causes me to make this
decision about the model’
For
example, don’t be afraid to tell stories with your comments. I like to
be very conversational; I like to say ‘Okay, now we’re going to do X’,
‘I noticed this about the output, and that causes me to make this
decision about the model’
For example here, I wrote, ‘To make
these calculations easier, I’m going to….’ do XYZ, and then I have some
lines of code.
Now, you’ll notice here that I only have about
four lines of code, and a LOT of lines of comments, and not all of my
scripts look like that. But I just want to get the point across that
it’s really okay to write essays in your code and to have your code
comments be informal, conversational and very
descriptive.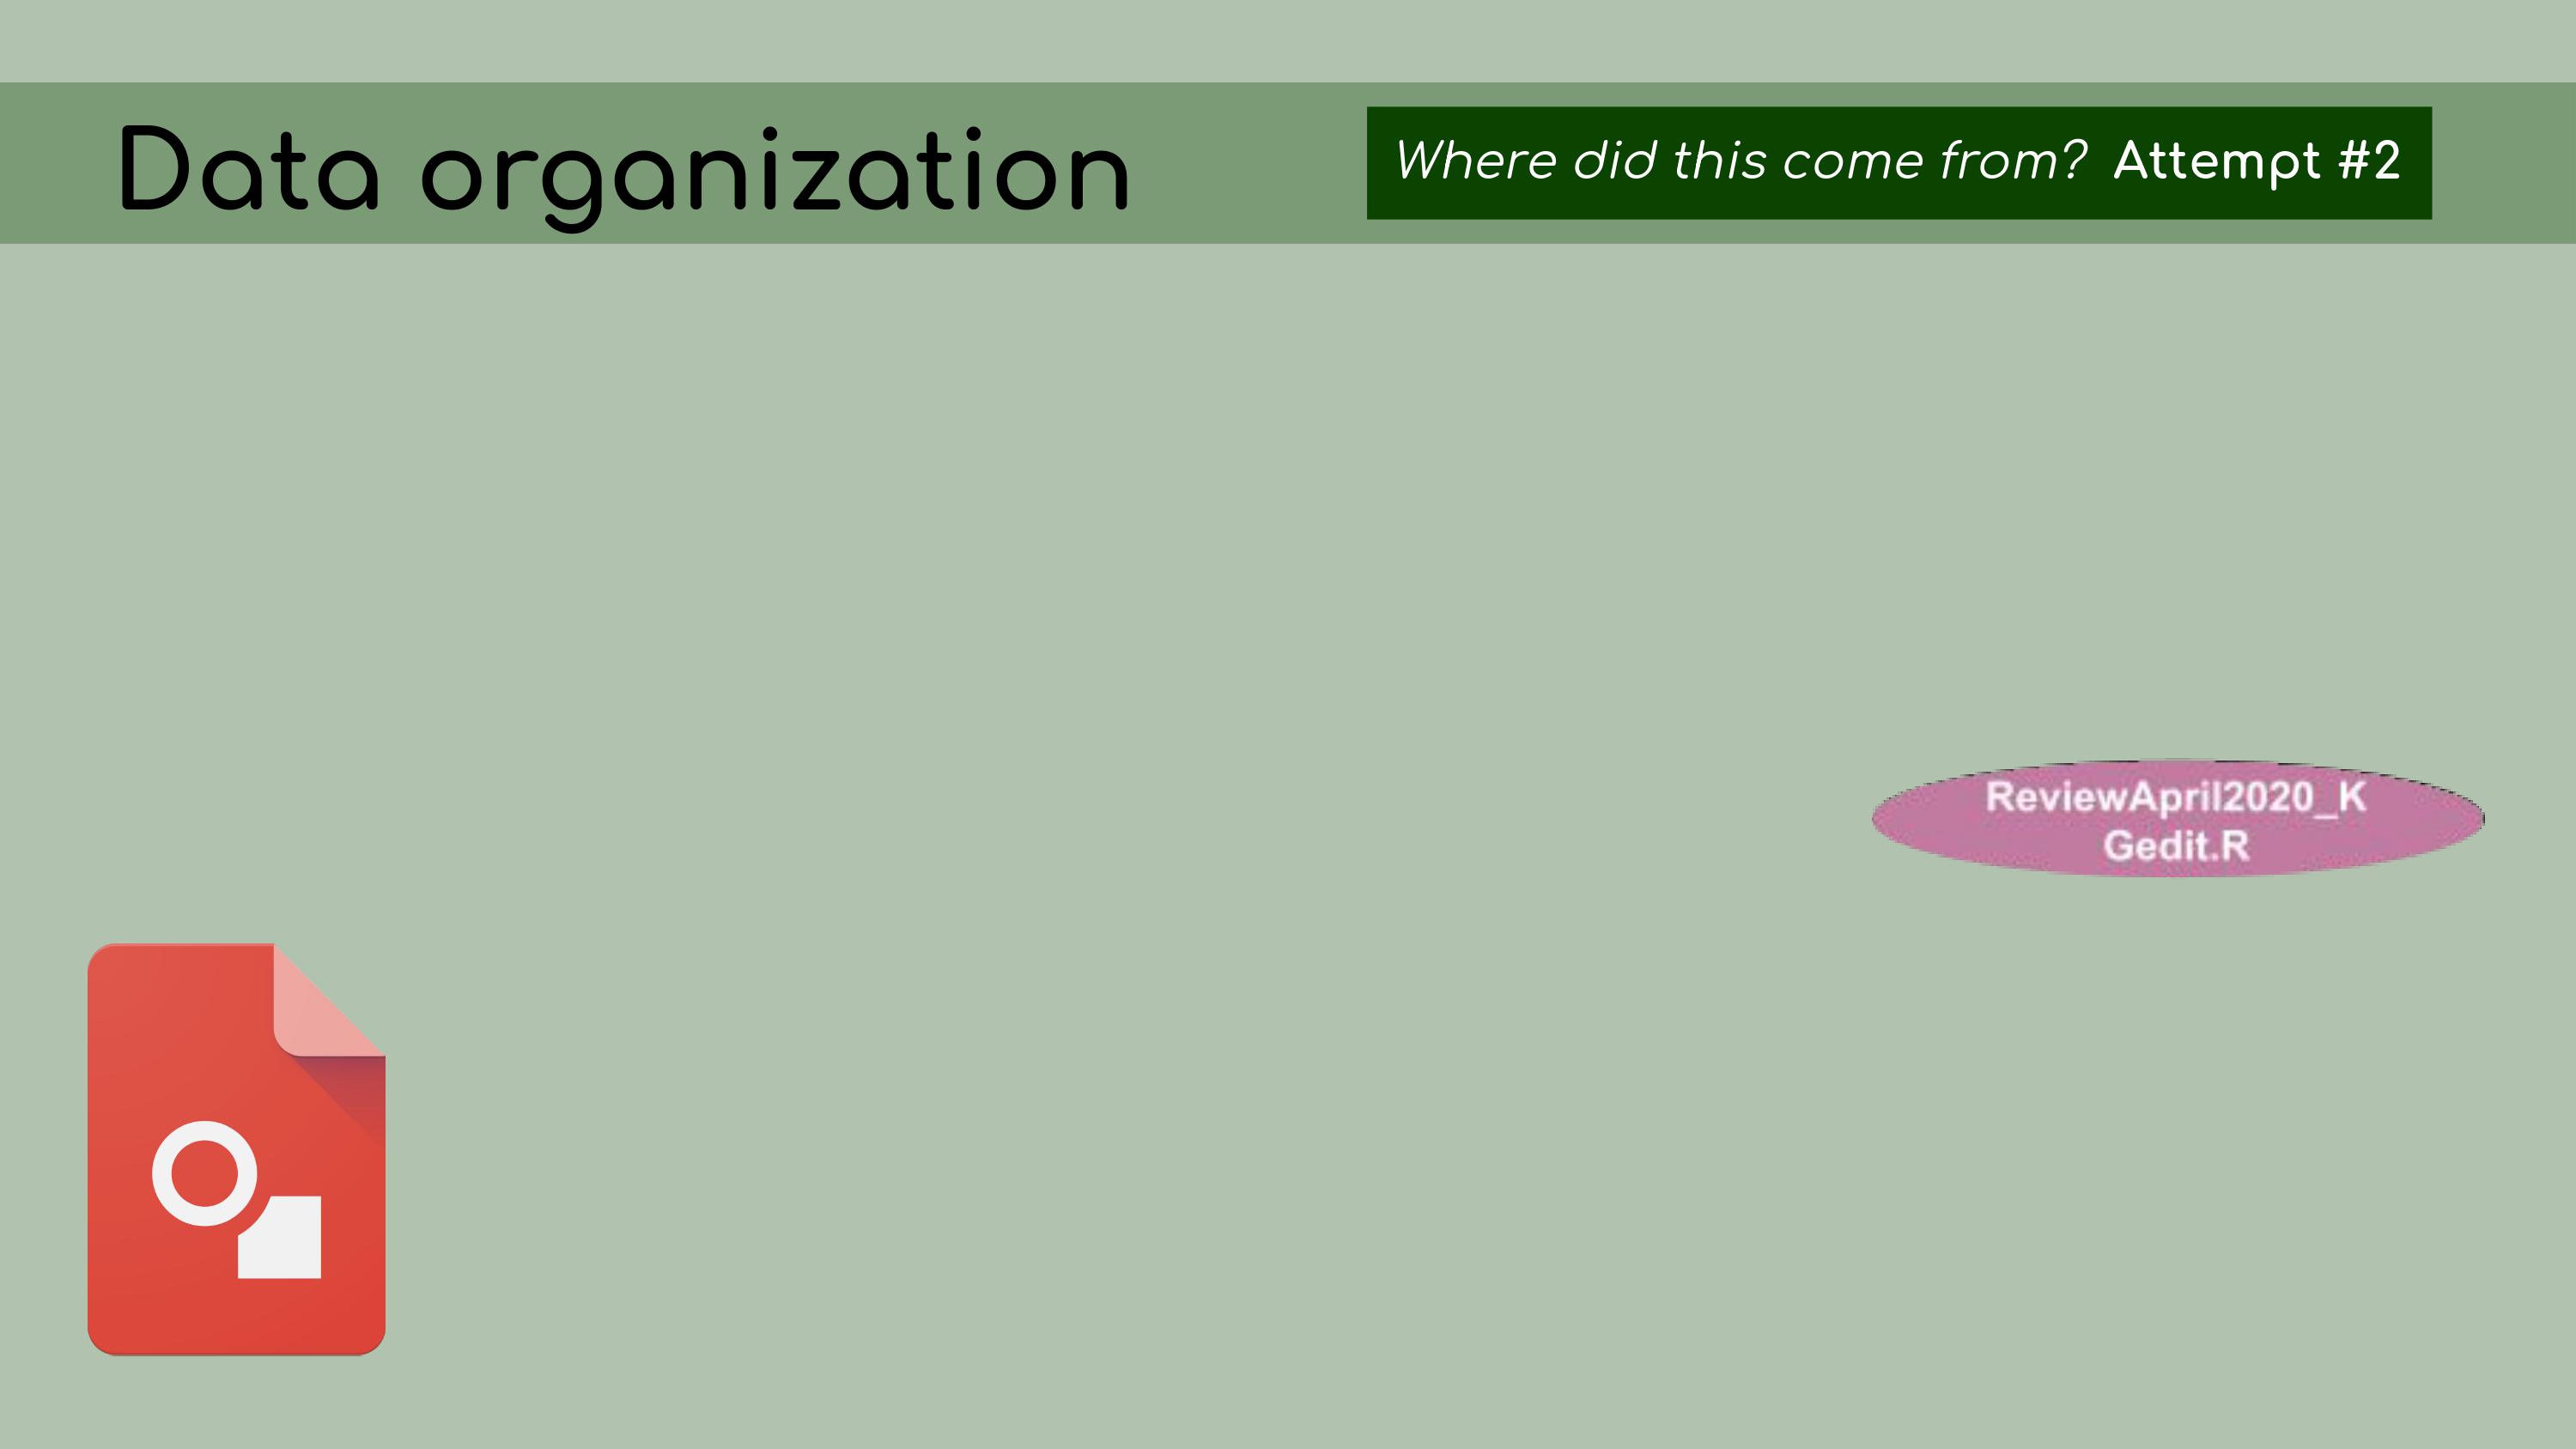 Something that
Chelsea did in her raw code files that I found very helpful when I went
through and organized them, was to keep track, in the comments, of
package versions and decisions that were made in the analyses, and file
paths. So for example, I already discussed how we had to use an older
version of the package
Something that
Chelsea did in her raw code files that I found very helpful when I went
through and organized them, was to keep track, in the comments, of
package versions and decisions that were made in the analyses, and file
paths. So for example, I already discussed how we had to use an older
version of the package geomorph, and conveniently, Chelsea
had recorded the version number of the older version that she was using,
so it was much easier for me to then restore that version when I started
using renv. You’ll notice that this script is far
from being perfect; it’s still using absolute file paths, it hasn’t yet
been edited to use the
You’ll notice that this script is far
from being perfect; it’s still using absolute file paths, it hasn’t yet
been edited to use the here package, but even without using
all best practices in reproducibility, just having these introductory
comments is really helpful.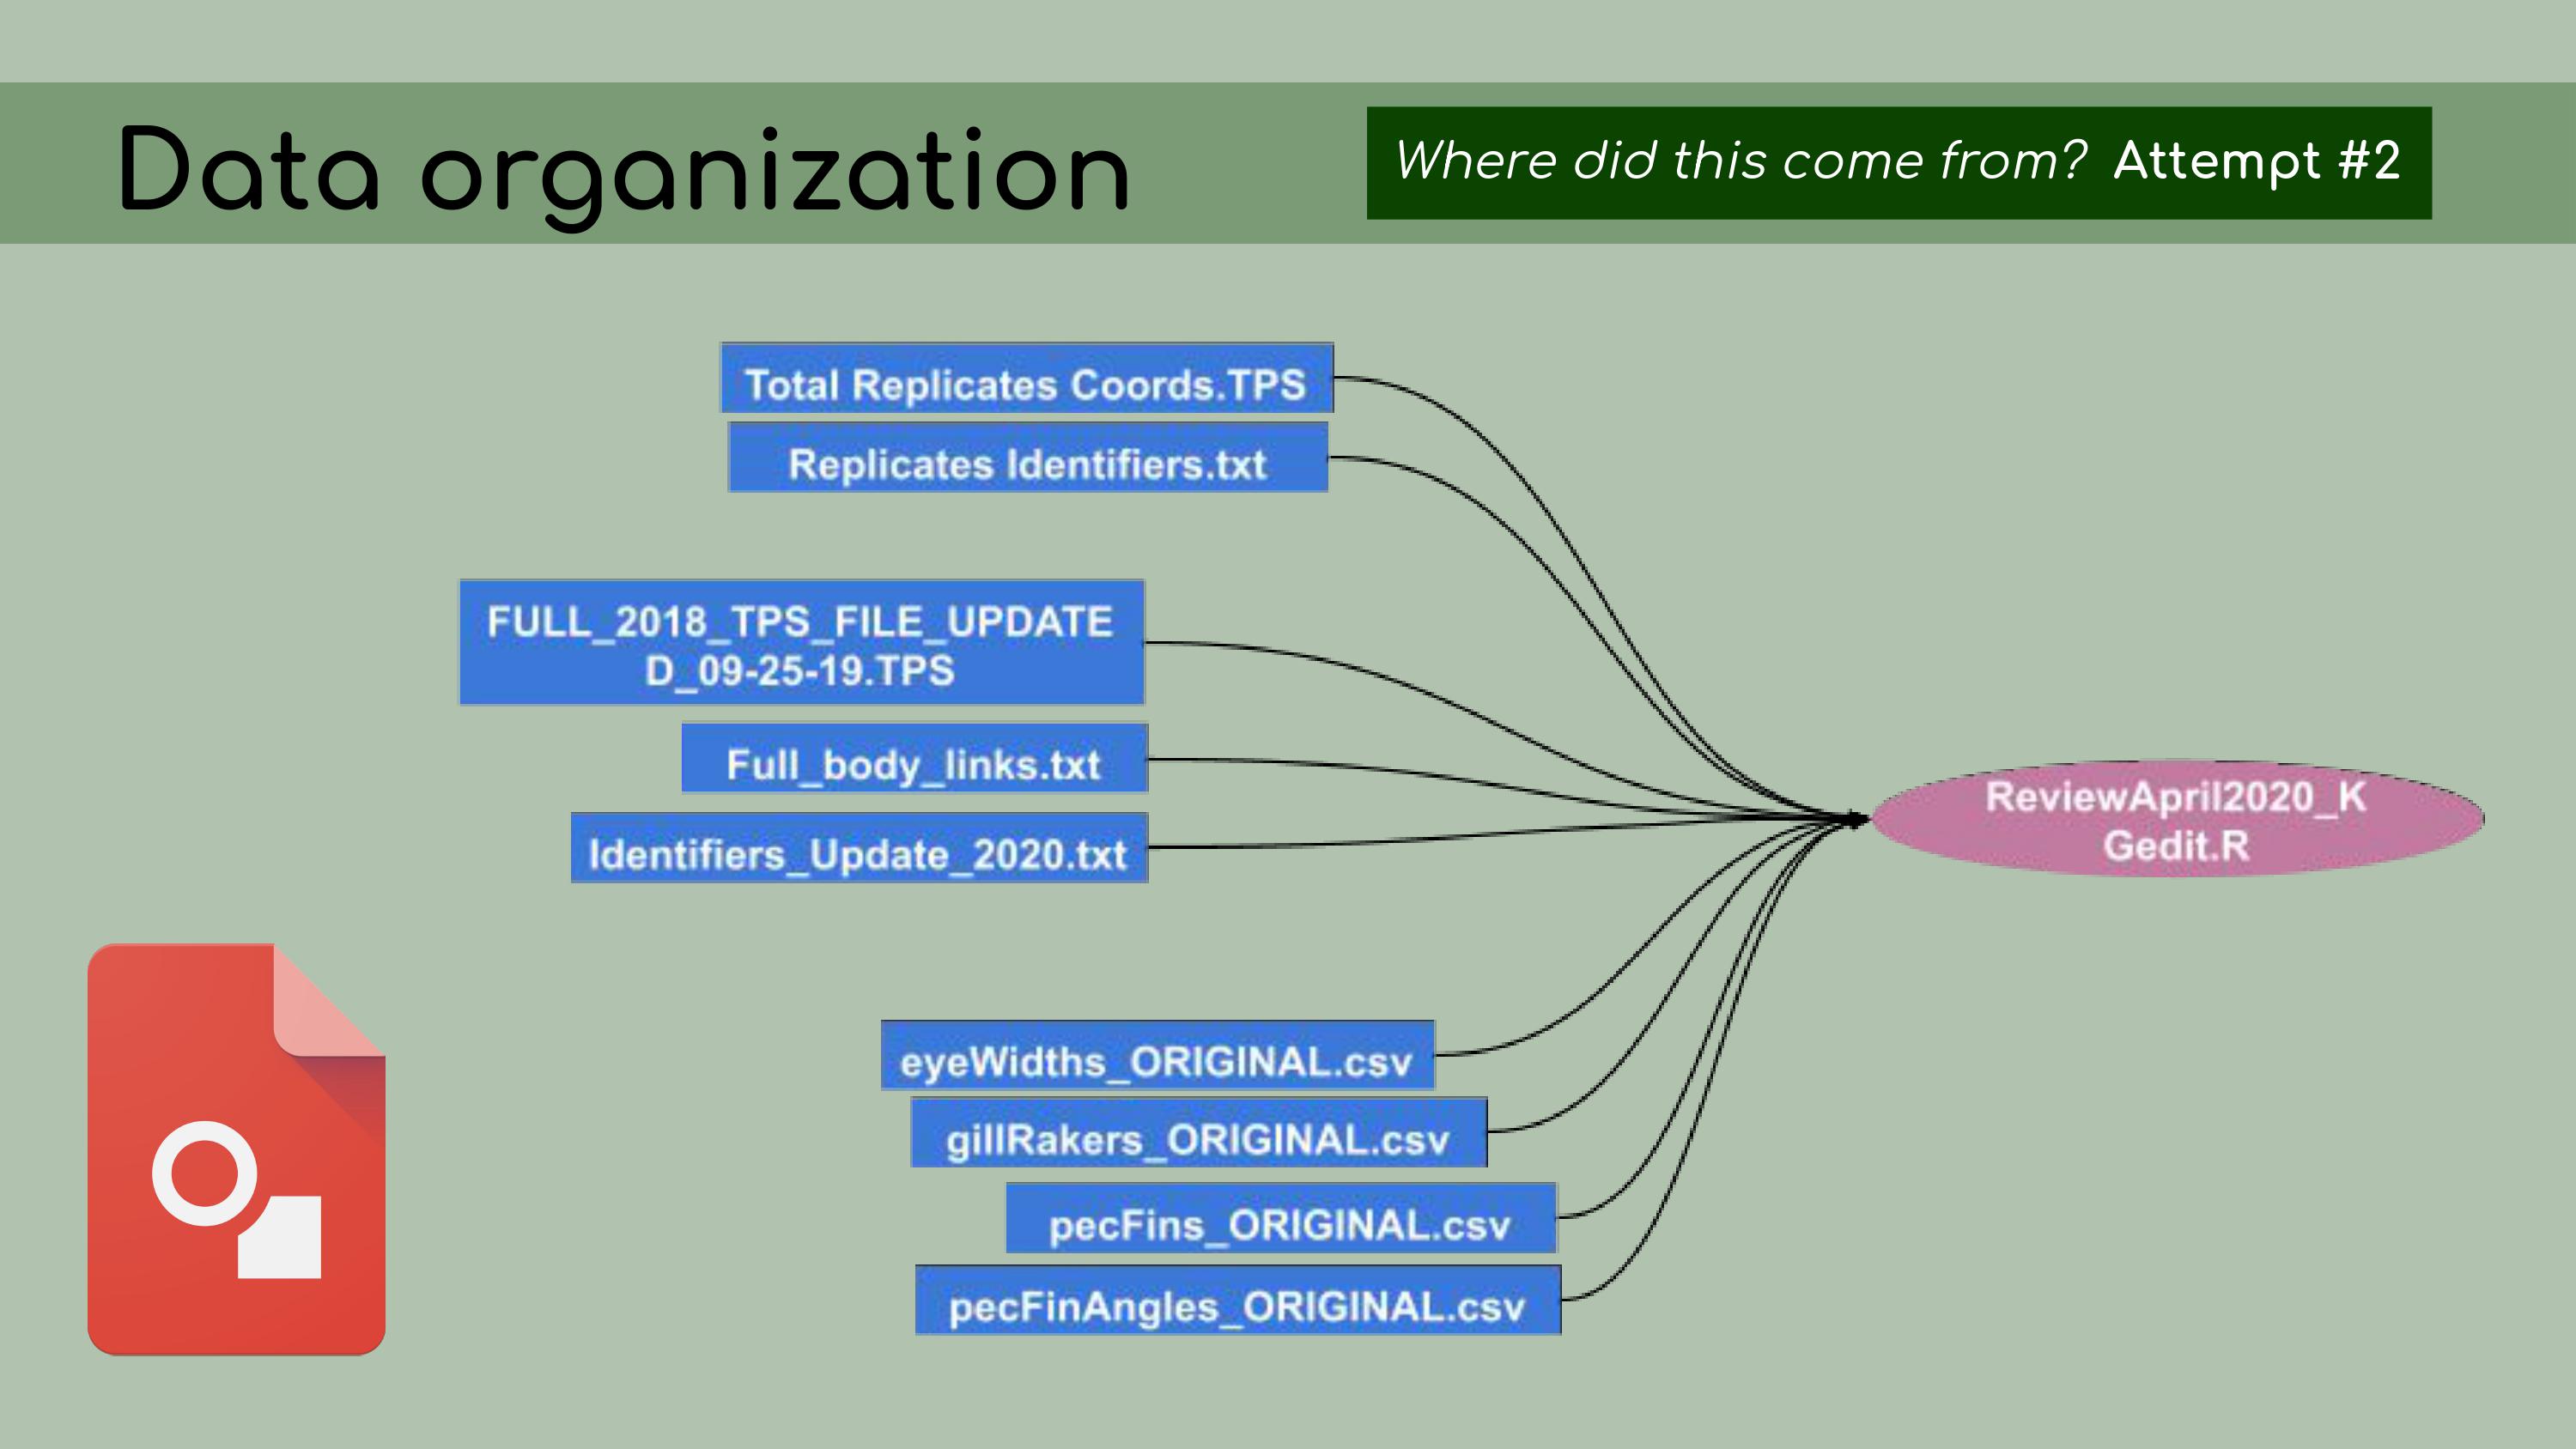 I want to conclude this talk by just
emphasizing that we really need to teach workflow in graduate programs,
undergraduate programs, whenever we teach coding. I would argue that,
for biologists, workflow, organization, and reproducibility are some of
the things that take up the greatest proportion of our research time.
They are actually more valuable skills sometimes than the actual
statistical analysis. They are also not intuitive.
I want to conclude this talk by just
emphasizing that we really need to teach workflow in graduate programs,
undergraduate programs, whenever we teach coding. I would argue that,
for biologists, workflow, organization, and reproducibility are some of
the things that take up the greatest proportion of our research time.
They are actually more valuable skills sometimes than the actual
statistical analysis. They are also not intuitive.
I think it
can be easy, as a student, to assume that if you’re just an organized
person, you will magically know how to organize your code. And then it’s
easy to get frustrated when that doesn’t come naturally and when no one
has really taught you what the best practices are.
I think this
resource, written by Jenny Bryan and Jim Hester, ‘What they forgot to
teach you about R’, is a great example of this. This resource focuses on
a lot of the workflow tactics that I’ve been talking about here, like a
project-oriented workflow, and it’s titled ‘What they forgot to teach
you about R’. And I think for many students, that’s exactly true. They
do forget to teach you the workflow stuff, and that’s sometimes the most
important part. Here’s
a list of resources that I put together related to the various tools for
reproducibility that I’ve talked about in this
presentation
Here’s
a list of resources that I put together related to the various tools for
reproducibility that I’ve talked about in this
presentation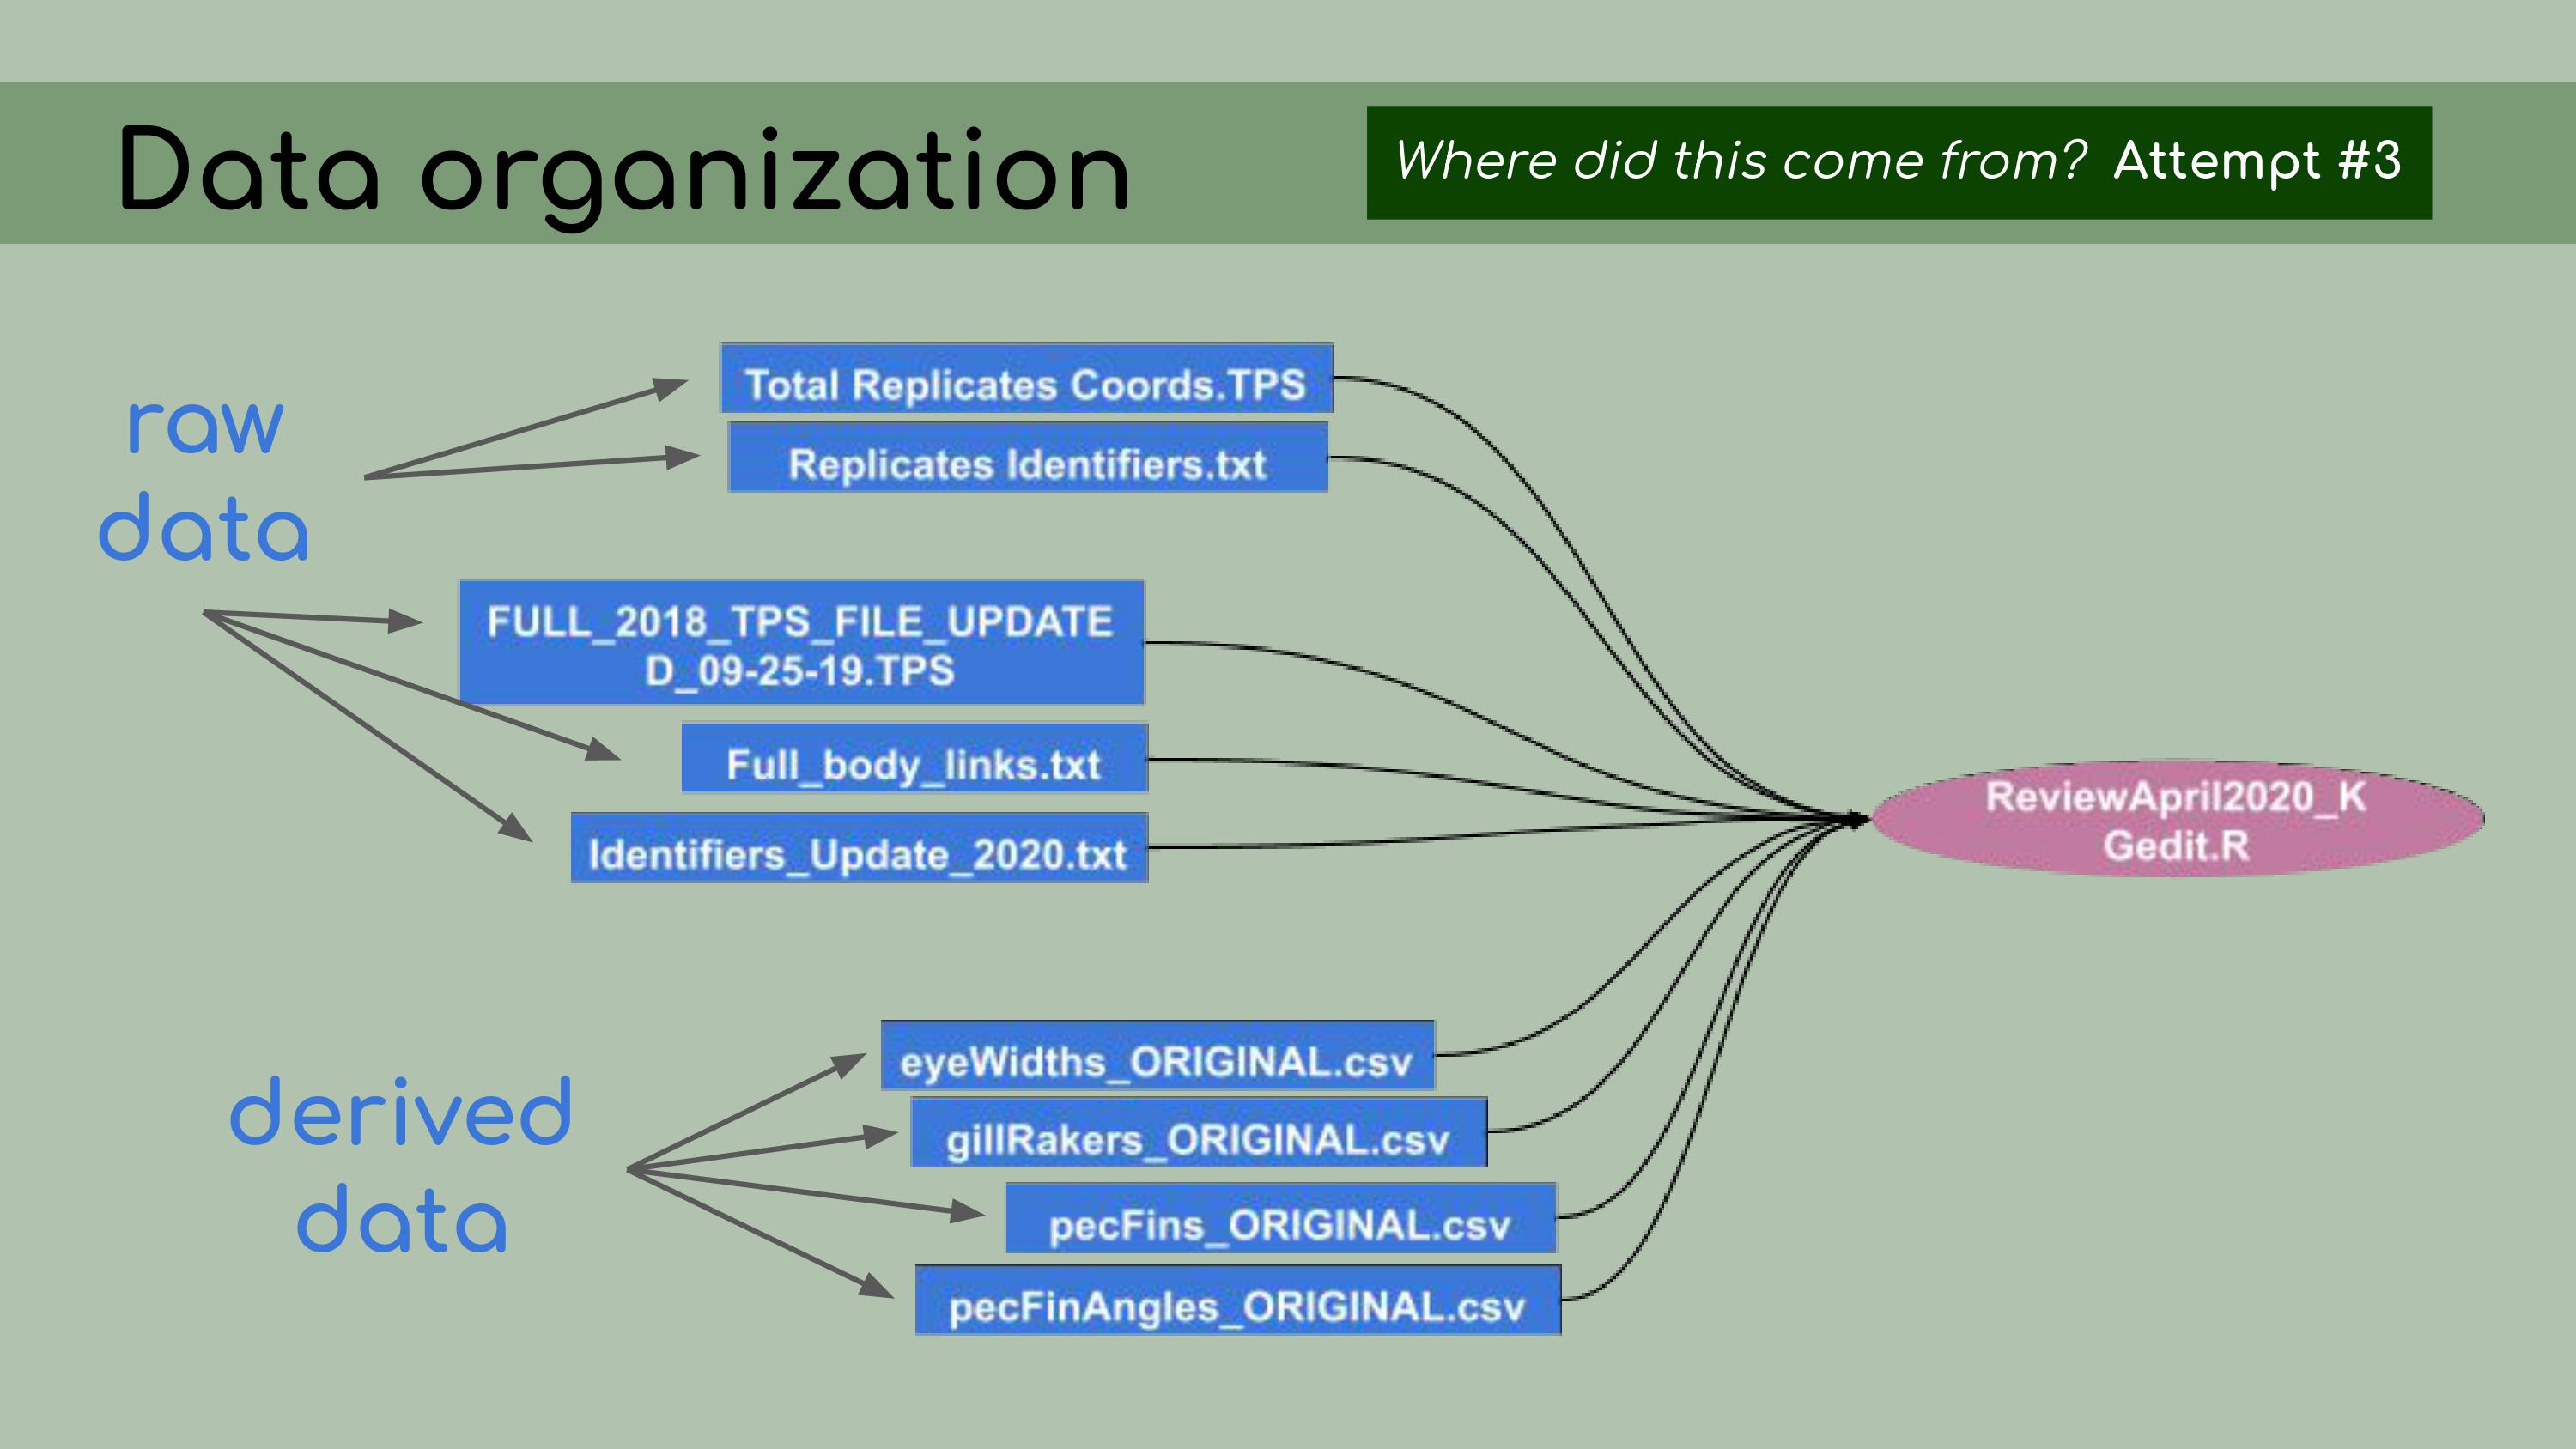 And I would be
happy to take any questions at the Q&A session right after this
talk. Thank you very much.
And I would be
happy to take any questions at the Q&A session right after this
talk. Thank you very much. Hello everyone! Thank you for being
here. My name is Kaija Gahm, and I’m a data manager at the Cary
Institute of Ecosystem Studies. Late last year, my colleague Chelsea had
just finished her Master’s thesis, and my supervisor asked me to help
her to organize her code and analysis into a reproducible workflow that
we could reference in the manuscript that we were putting together.
Hello everyone! Thank you for being
here. My name is Kaija Gahm, and I’m a data manager at the Cary
Institute of Ecosystem Studies. Late last year, my colleague Chelsea had
just finished her Master’s thesis, and my supervisor asked me to help
her to organize her code and analysis into a reproducible workflow that
we could reference in the manuscript that we were putting together.
In this talk, I’m going to be speaking about my experience
implementing data management and reproducibility tools retroactively,
for an existing project, even if best practices weren’t used from the
beginning. I’ll also discuss organizing and making sense of someone
else’s analyses, approaching the project as an outsider.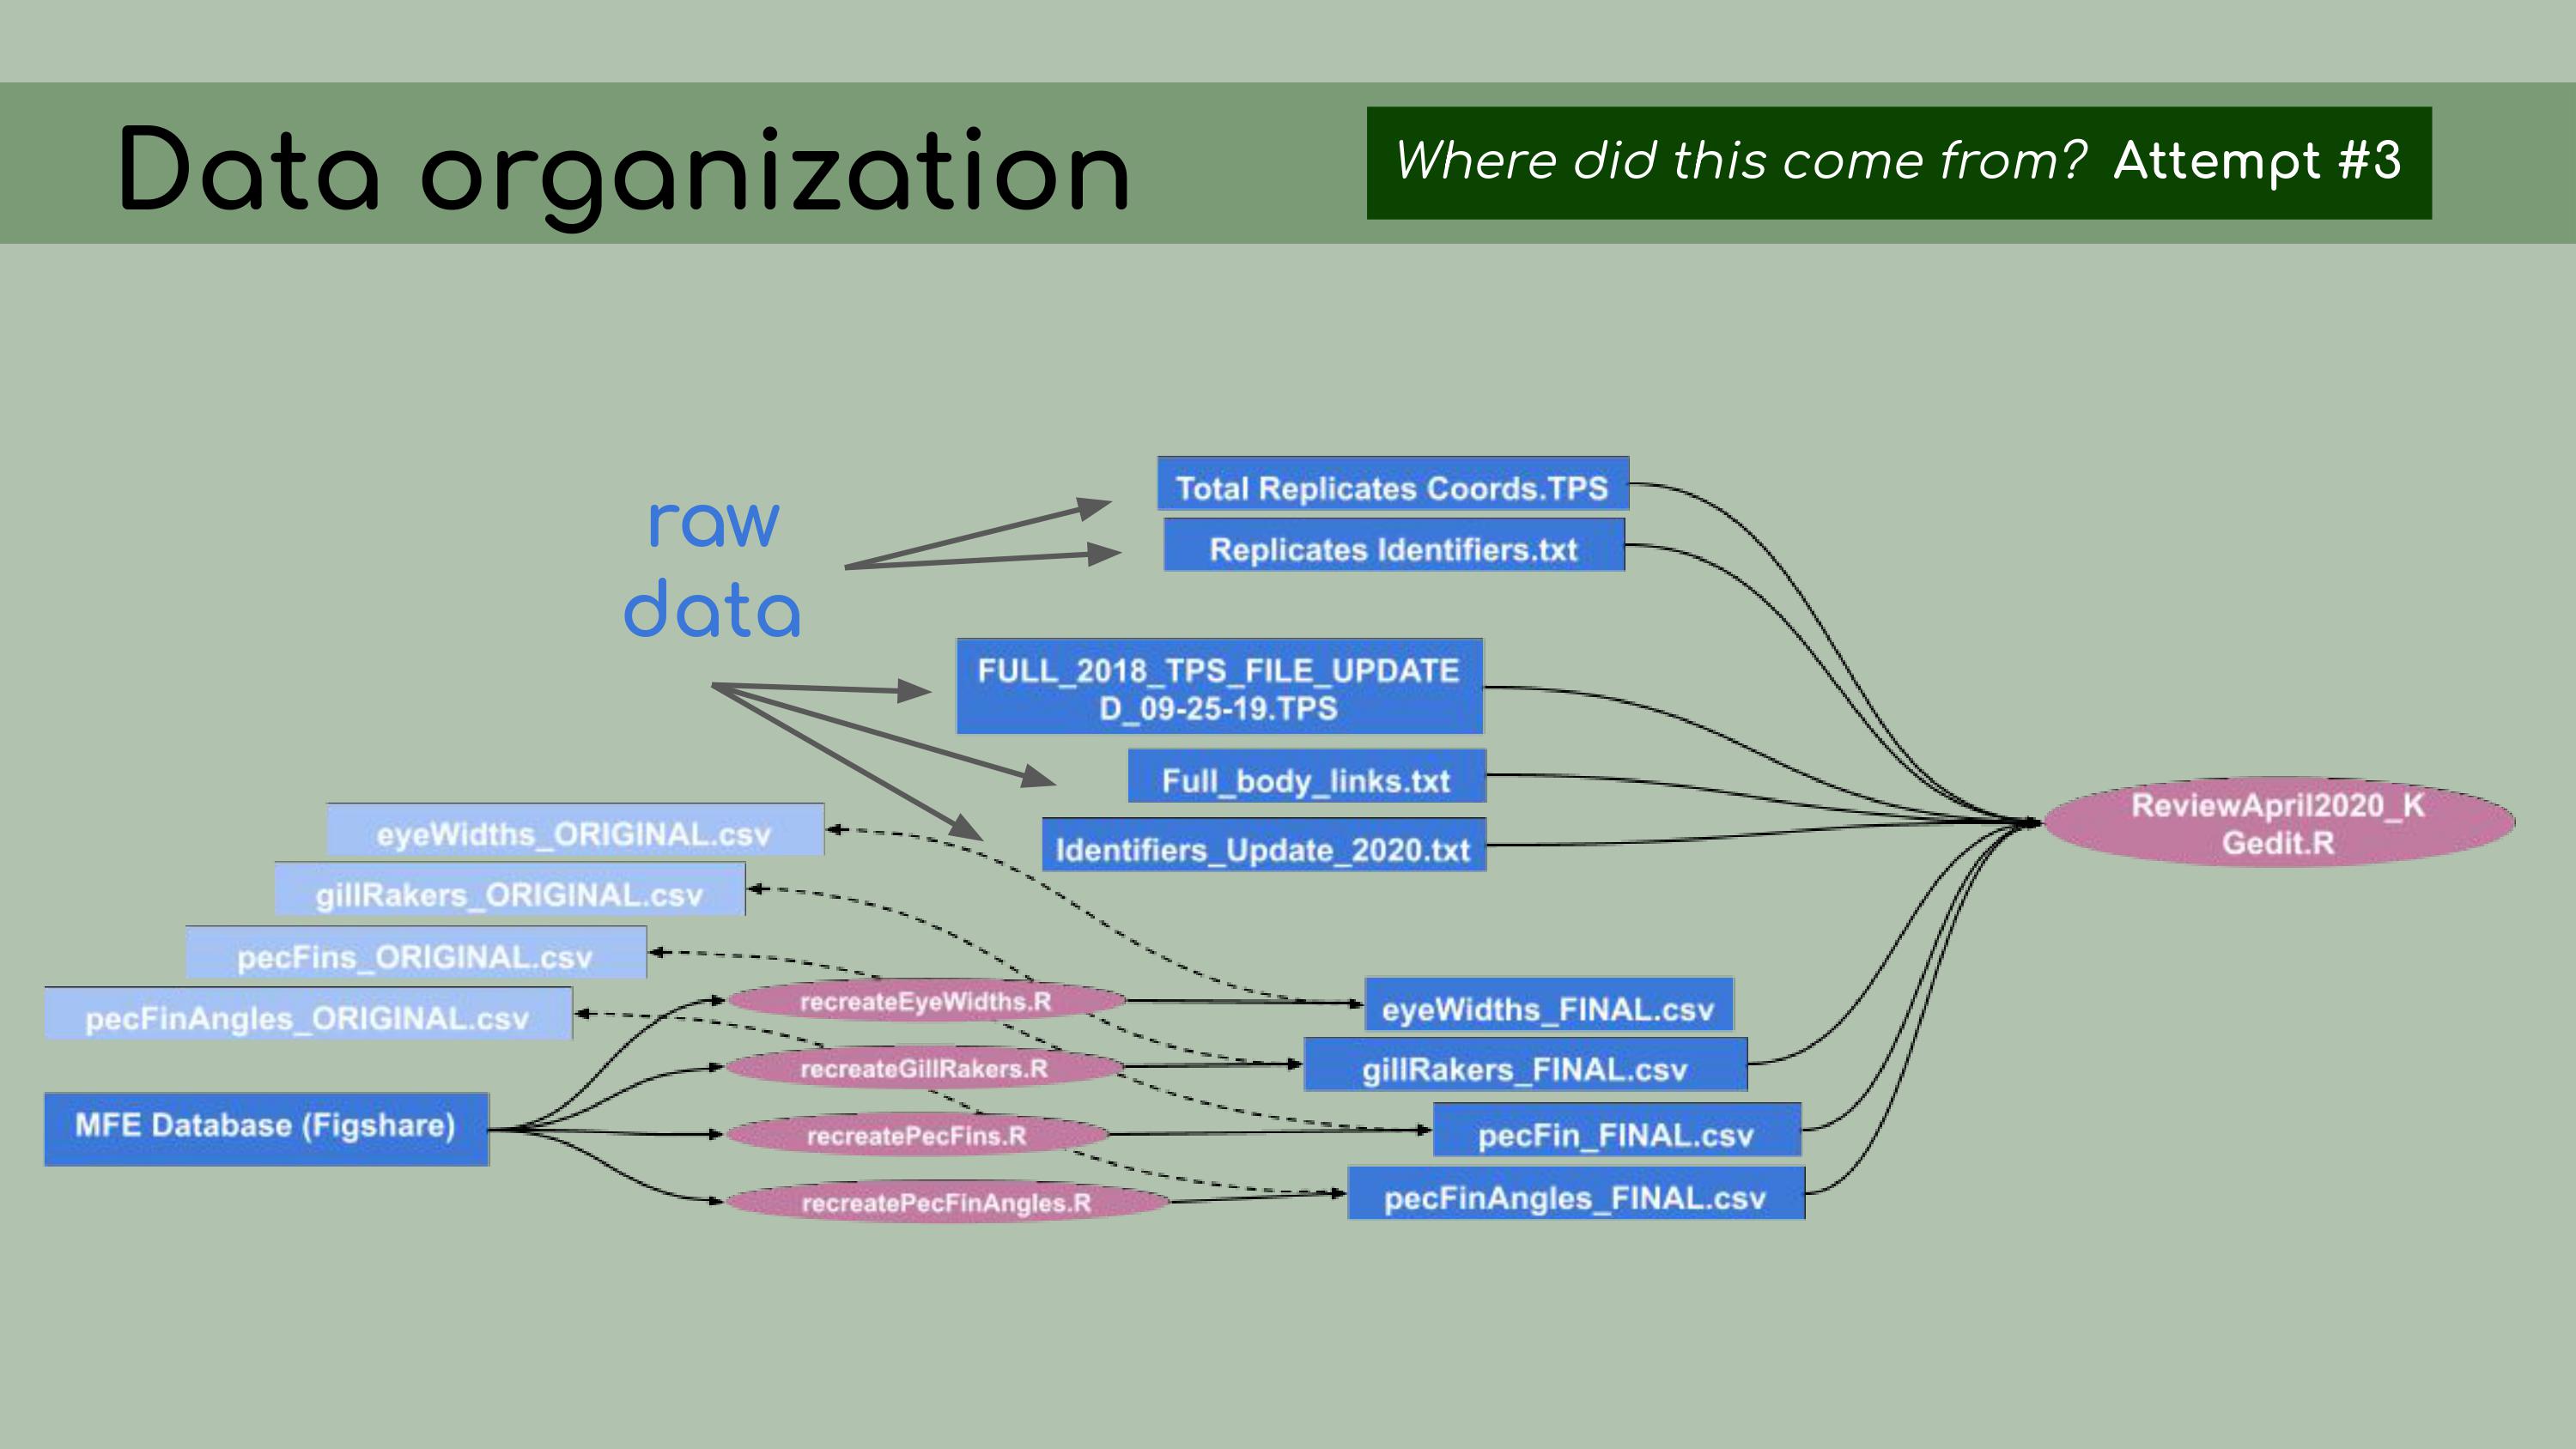 A little bit of background on the project:
It consisted of some pretty typical ecological data––measurements of
lake dissolved organic carbon, morphometric landmarks of bluegill
sunfish, and a bunch of statistical analyses and
figures.
A little bit of background on the project:
It consisted of some pretty typical ecological data––measurements of
lake dissolved organic carbon, morphometric landmarks of bluegill
sunfish, and a bunch of statistical analyses and
figures.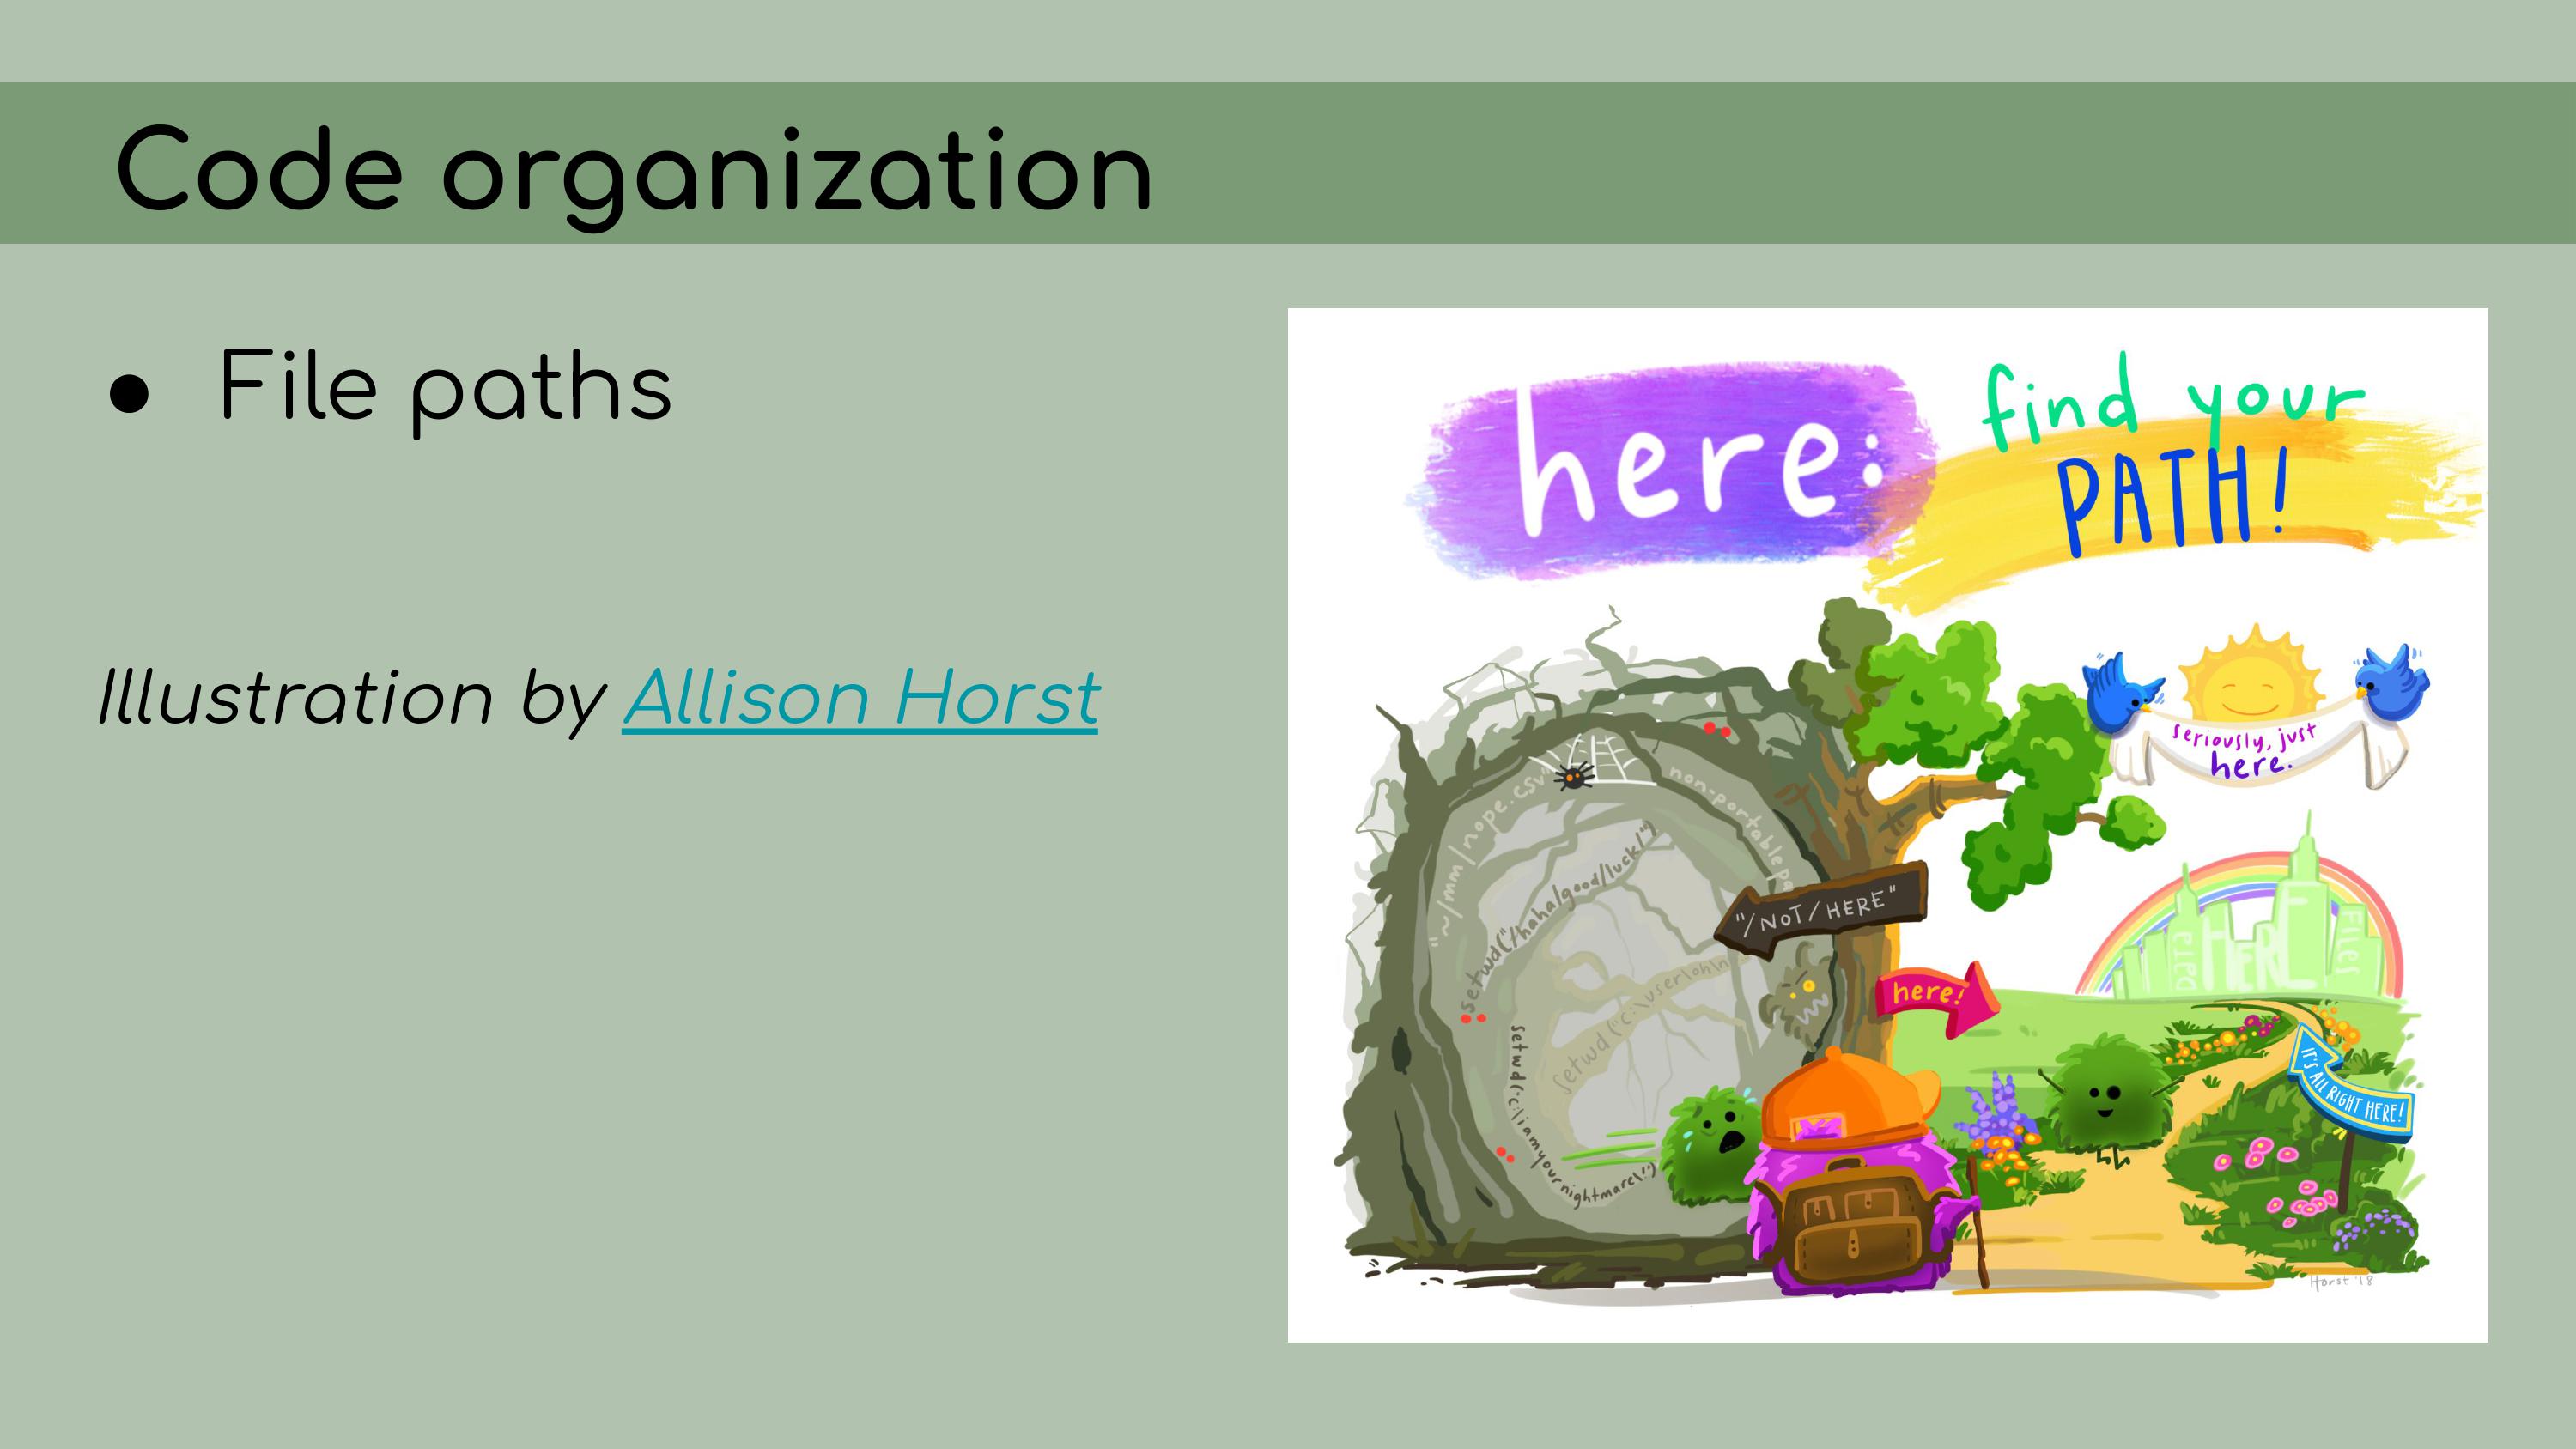 Some of the
challenges I knew I was going to face were that the data had largely
been edited manually in Excel, or copied and pasted from other files
with uncertain origin.
Some of the
challenges I knew I was going to face were that the data had largely
been edited manually in Excel, or copied and pasted from other files
with uncertain origin. There were many file versions, and it
wasn’t really clear how the data and code tied together.
There were many file versions, and it
wasn’t really clear how the data and code tied together.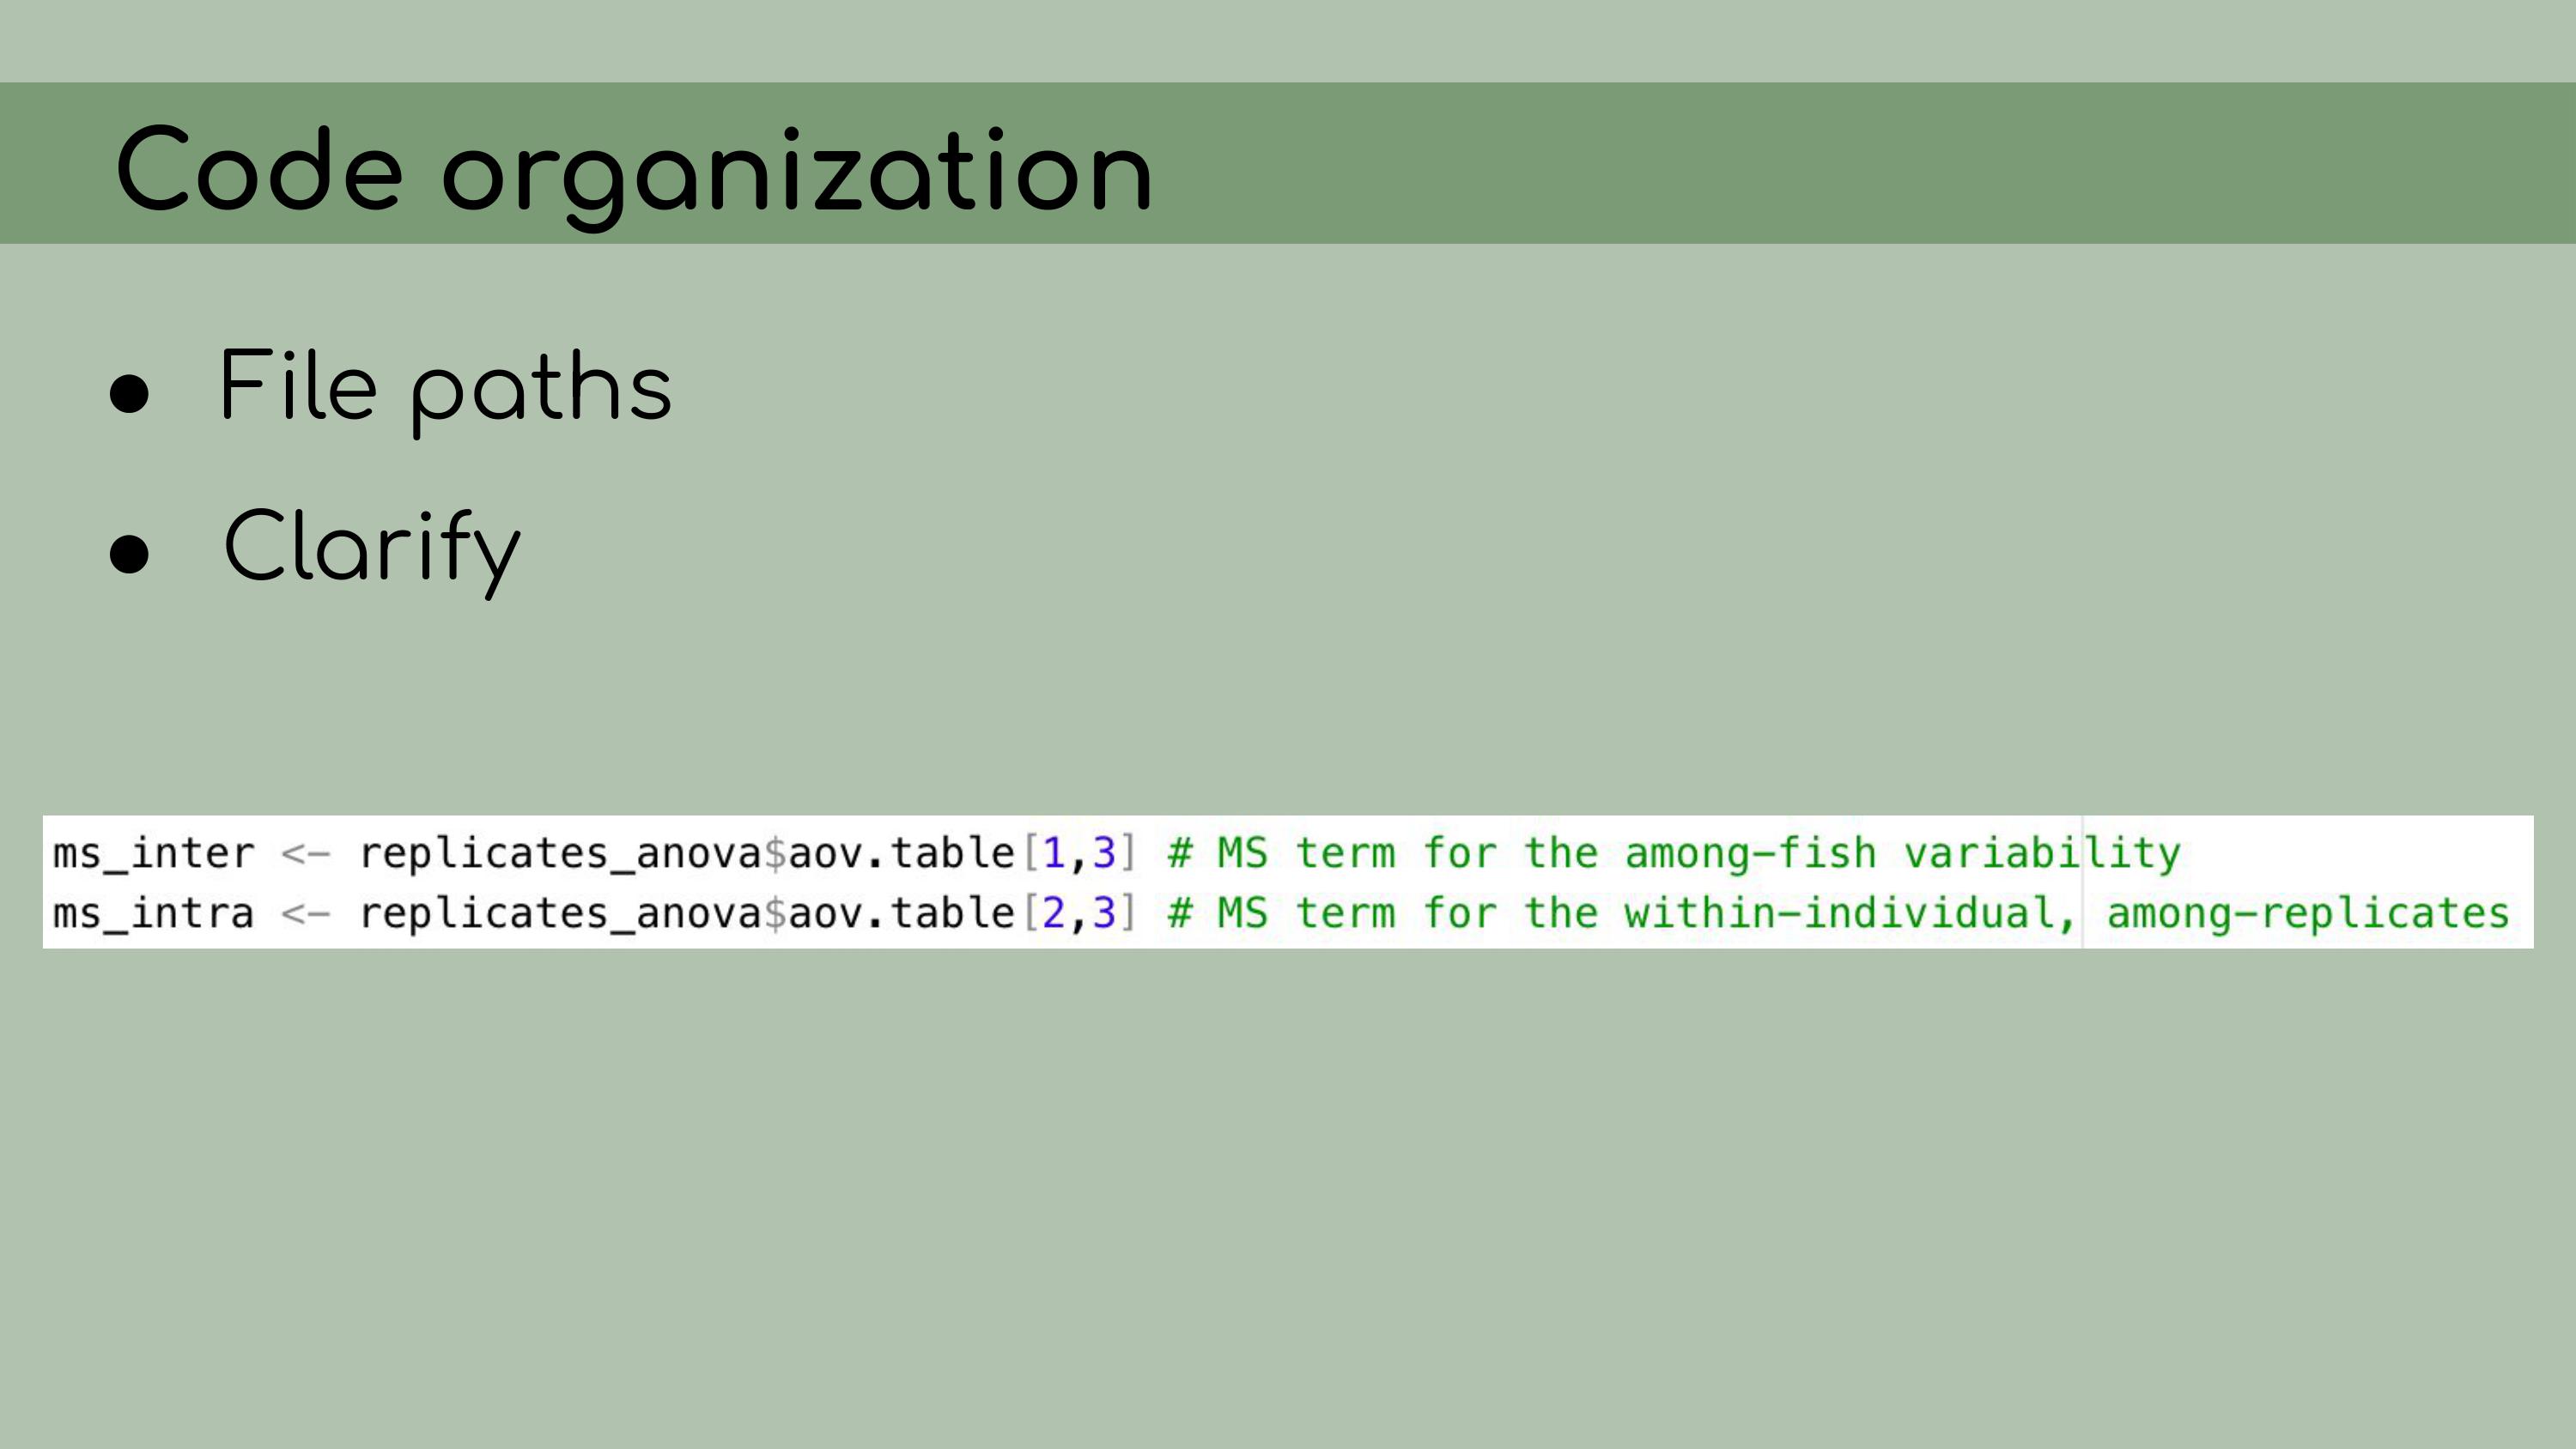 The goal of my work was to compile all
of this data and code into a reproducible analysis. I knew that we were
going to be storing the data on Figshare; all of the analyses would be
conducted in RStudio and stored on GitHub. The data and code could be
then referenced in the final manuscript.
The goal of my work was to compile all
of this data and code into a reproducible analysis. I knew that we were
going to be storing the data on Figshare; all of the analyses would be
conducted in RStudio and stored on GitHub. The data and code could be
then referenced in the final manuscript. To begin my work, I asked Chelsea to start
by uploading all of her files to GitHub.
To begin my work, I asked Chelsea to start
by uploading all of her files to GitHub. I think GitHub is a very important
tool, not just technically, for version control, but also
psychologically. If everything was being version controlled, then I
would have the power to edit and delete without being burdened by the
idea that I might be deleting something very important. I knew that as
long as everything was on GitHub, I could always walk the repository
back to its original version.
I think GitHub is a very important
tool, not just technically, for version control, but also
psychologically. If everything was being version controlled, then I
would have the power to edit and delete without being burdened by the
idea that I might be deleting something very important. I knew that as
long as everything was on GitHub, I could always walk the repository
back to its original version. My first step in organizing this repository
was to set it up as an RStudio Project, which means that it would open a
fresh R session for everyone who downloaded the code, and all file paths
could be written relative to the root directory.
My first step in organizing this repository
was to set it up as an RStudio Project, which means that it would open a
fresh R session for everyone who downloaded the code, and all file paths
could be written relative to the root directory.
I also
implemented renv, which is a great package that allows for
managing package versions. This was particularly important in the case
of this analysis, because some of the code depended on an old version of
the geomorph package for analyzing morphometric landmarks.
I personally wasn’t very familiar with the package, so even if I had
wanted to update the code to the newest version, I wouldn’t really have
been able to. Using renv allowed me to run the code with
the old version of the package, and it ensures that anyone who wants to
run our analysis in the future will be able to restore the packages from
the lockfile and immediately proceed without affecting packages on their
own computer.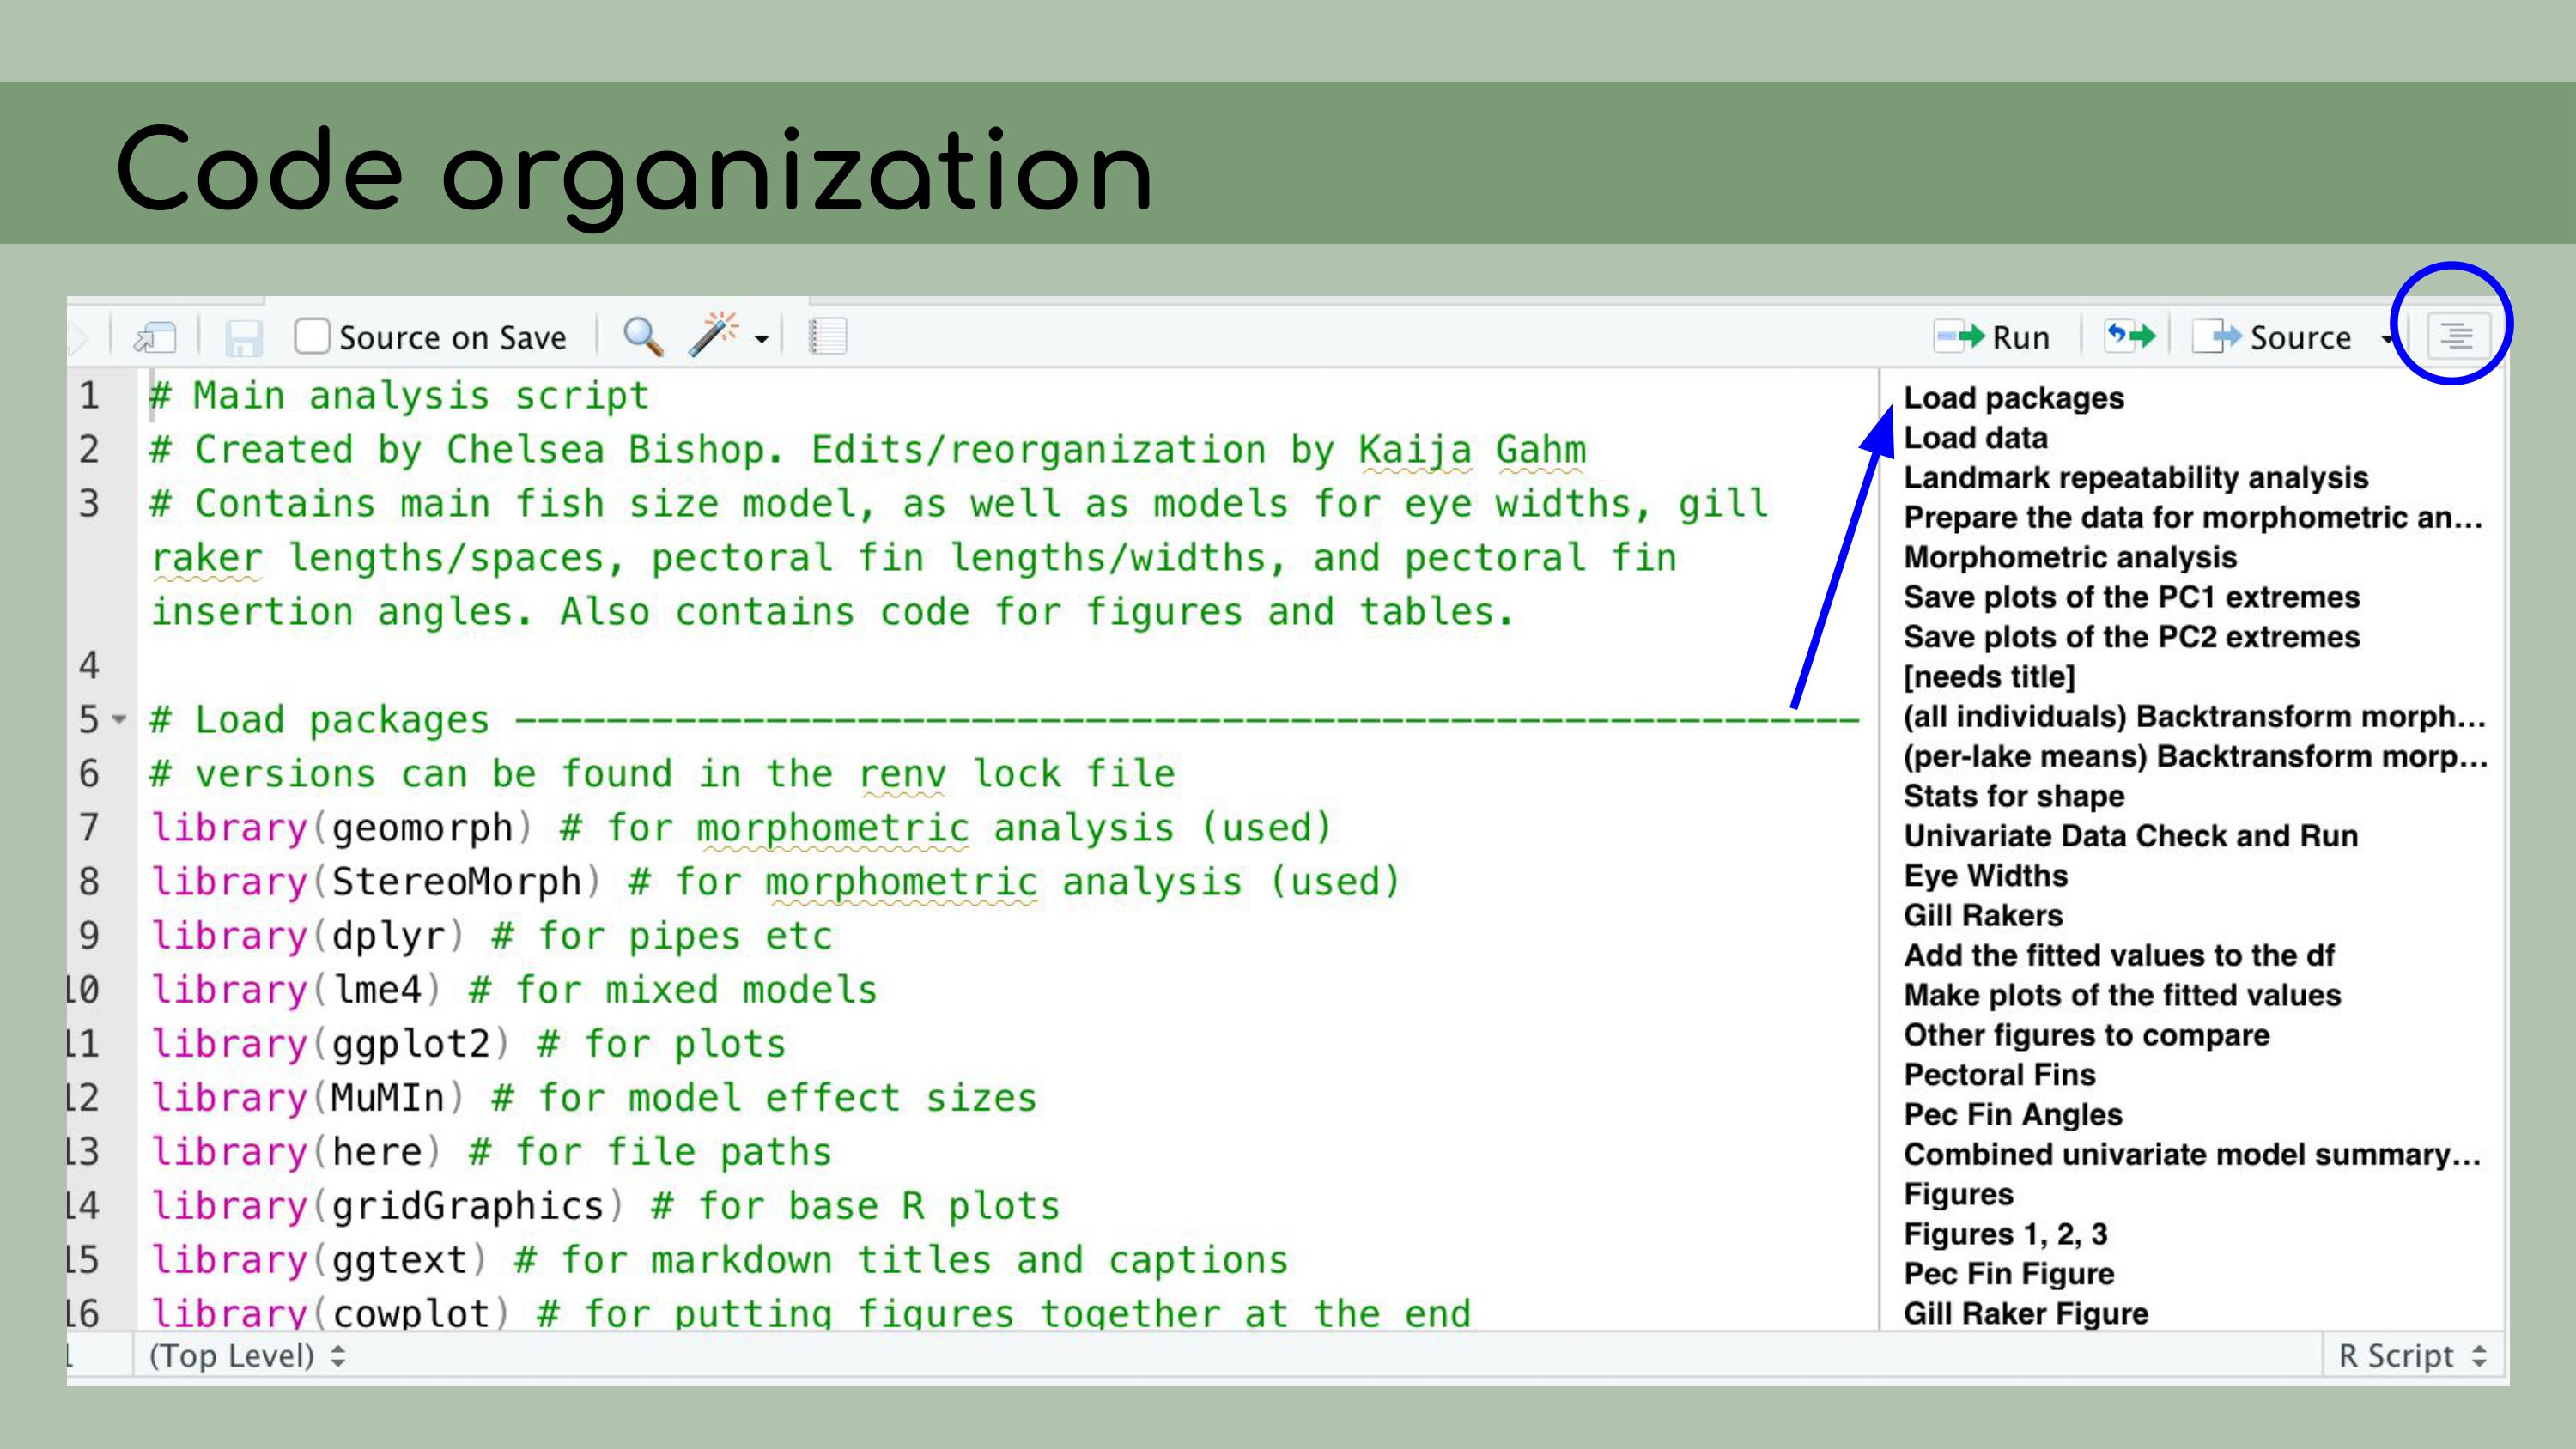 My next
step was to organize the data.
My next
step was to organize the data.
The first principle is that raw
data is sacred and should not be modified. So that means no copying and
pasting.
Derived data should then be fully reproducible and, by
extension, disposable. I should be able to just delete all of the
derived data, and then recreate it by re-running the scripts in the
pipeline.
Now, that might be a bit of a pain because some of the
analyses might take a long time to run, but it would be possible in a
fully reproducible analysis.
And my job approaching this project
was to distinguish between data that was raw––like maybe it was created
manually or it was exported from a program somewhere else––versus data
that could be regenerated from the analysis code. This is a list of all the data files that I
was originally presented with in the GitHub repository, and it was
pretty overwhelming. I had to sort through all of those and figure out
which were raw, which were derived, and where they all went in the
pipeline.
This is a list of all the data files that I
was originally presented with in the GitHub repository, and it was
pretty overwhelming. I had to sort through all of those and figure out
which were raw, which were derived, and where they all went in the
pipeline. And in order
to do this, I asked the key question, ‘Where did this come from?’ For
each file, I wanted to know, how was it generated? Can I trace the
origin of all the files and their columns?
And in order
to do this, I asked the key question, ‘Where did this come from?’ For
each file, I wanted to know, how was it generated? Can I trace the
origin of all the files and their columns?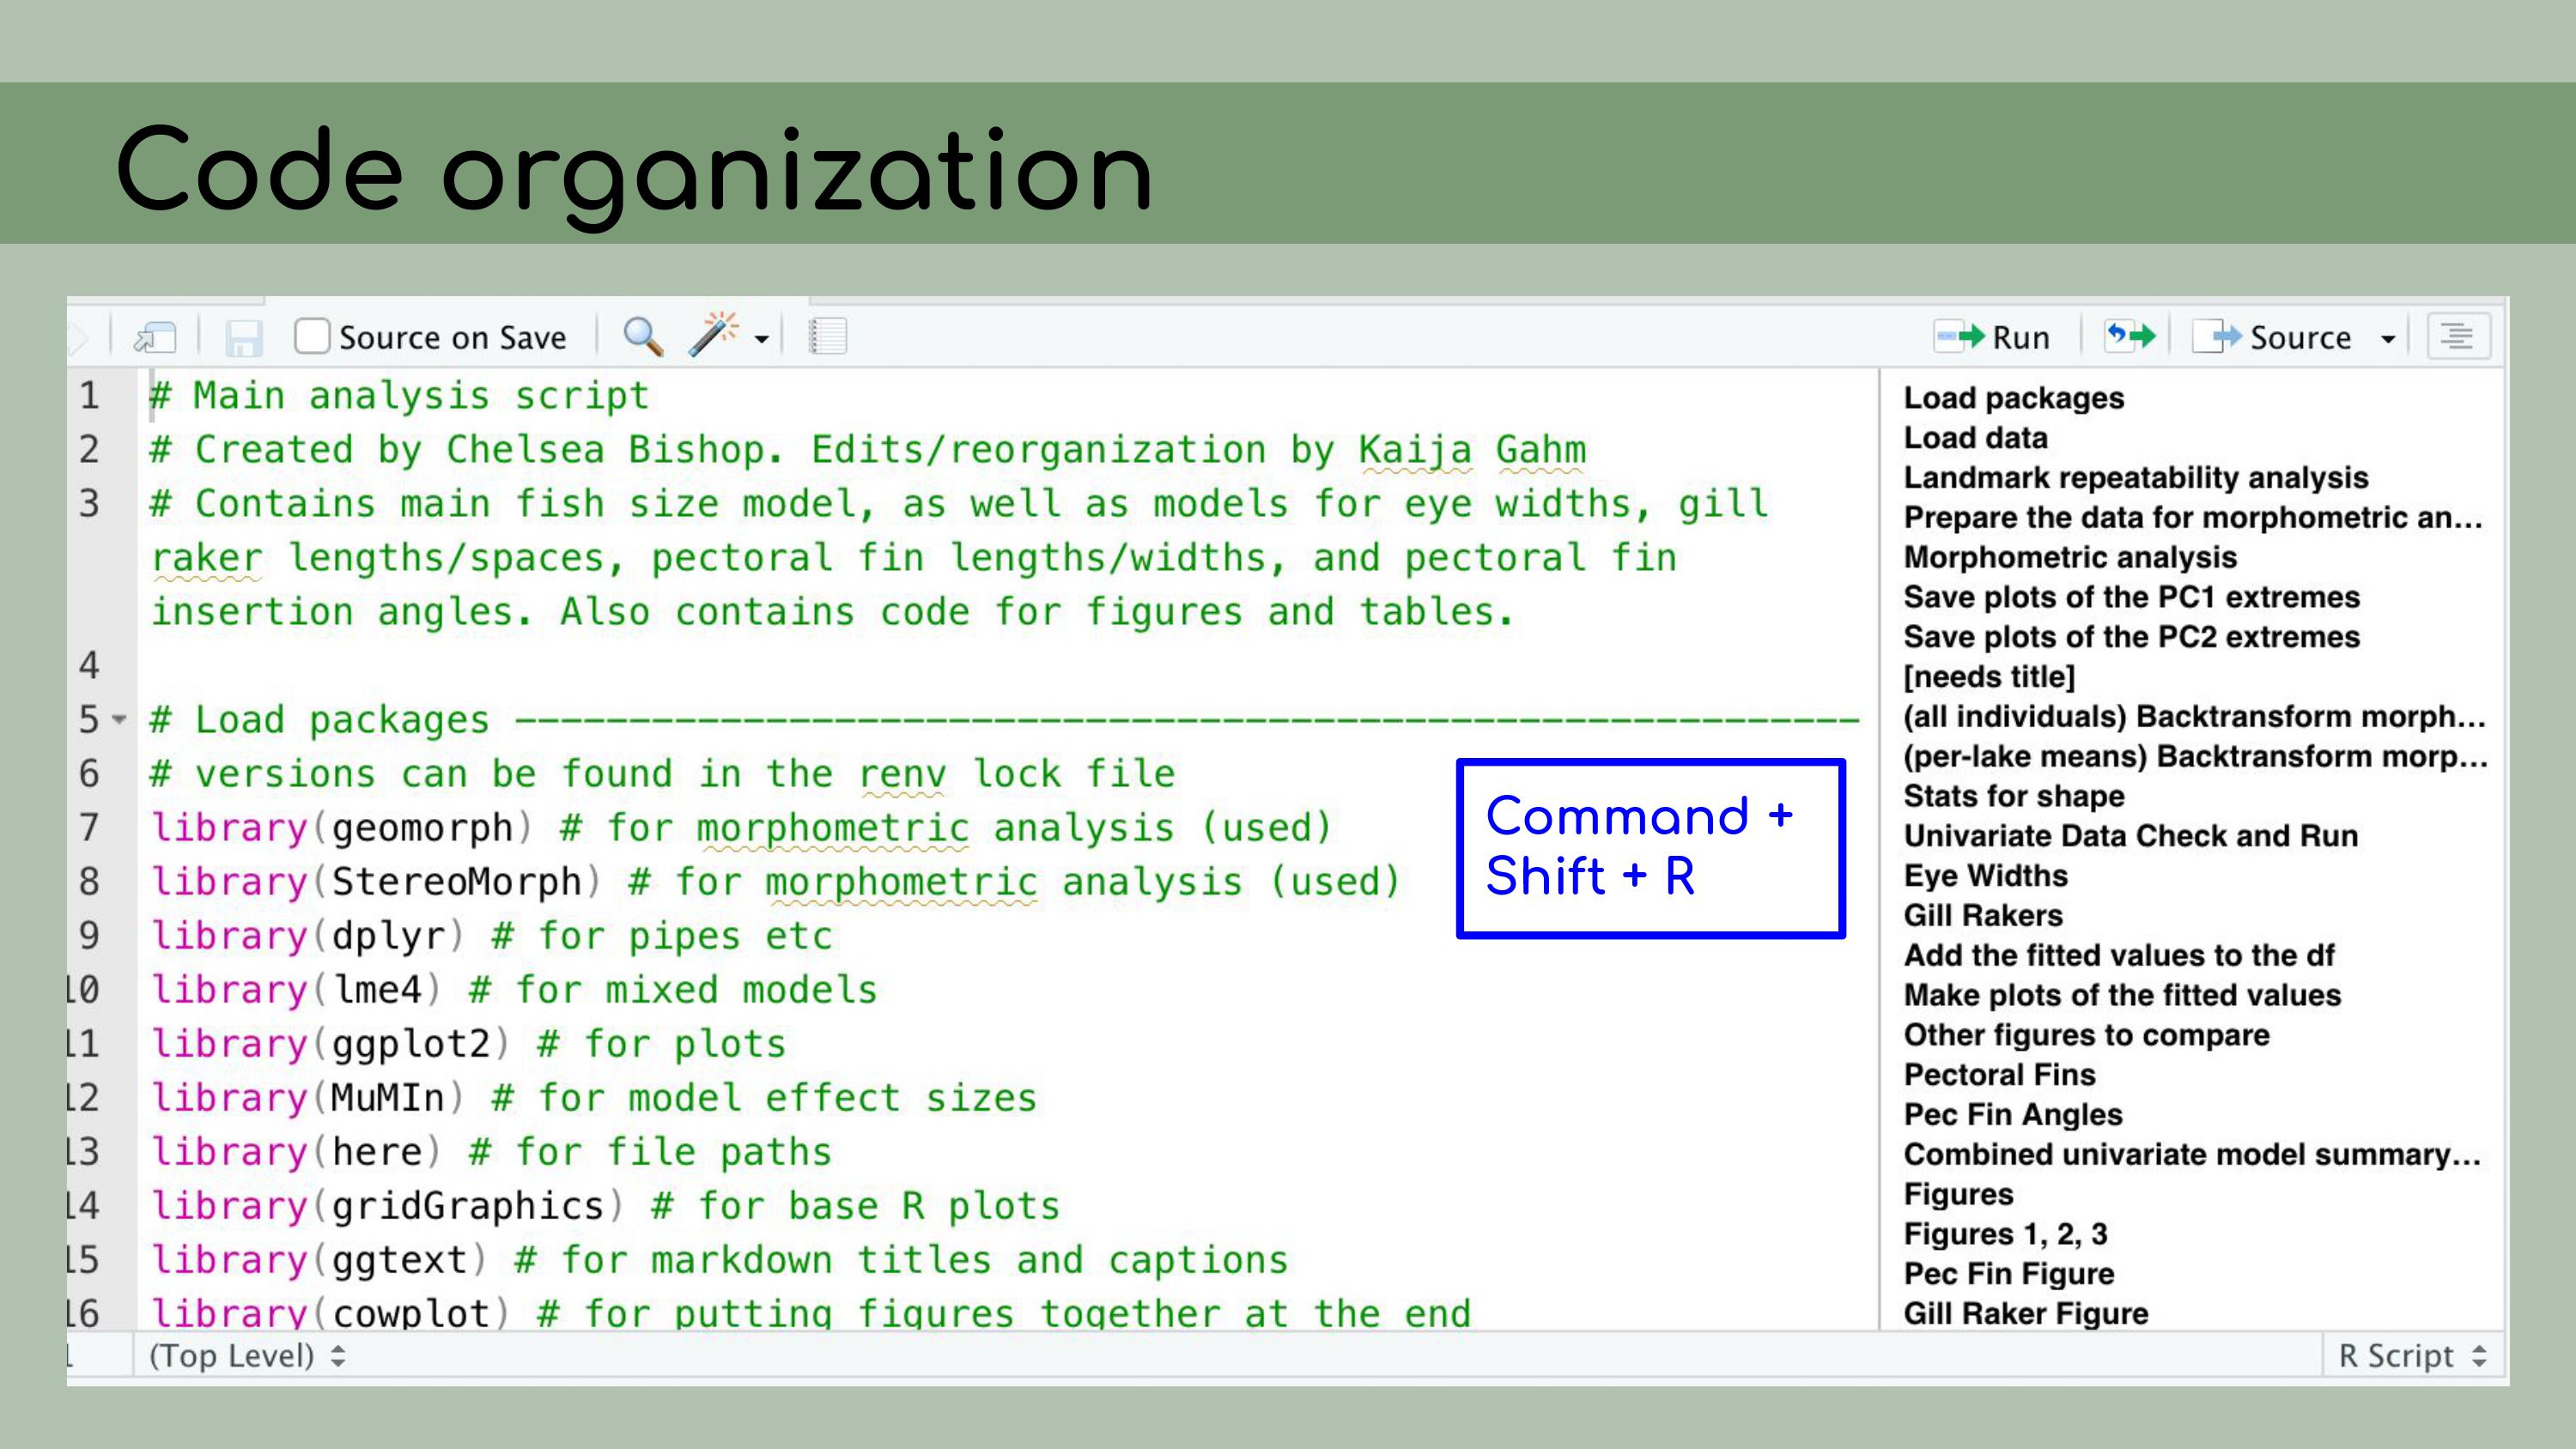 I started out by making a spreadsheet
listing out each file, and this seemed like a good idea at the time, but
it ended up being pretty overwhelming, and it was hard for Chelsea to go
through and answer my questions, especially because I was attacking all
the files at once, without regard for their importance or the order that
they might go in. I was just trying to get my head around
it.
I started out by making a spreadsheet
listing out each file, and this seemed like a good idea at the time, but
it ended up being pretty overwhelming, and it was hard for Chelsea to go
through and answer my questions, especially because I was attacking all
the files at once, without regard for their importance or the order that
they might go in. I was just trying to get my head around
it. Chelsea and I
decided that a better approach would be to start with the most recent
and up-to-date analysis file; in our case, called
ReviewApril2020.
Chelsea and I
decided that a better approach would be to start with the most recent
and up-to-date analysis file; in our case, called
ReviewApril2020.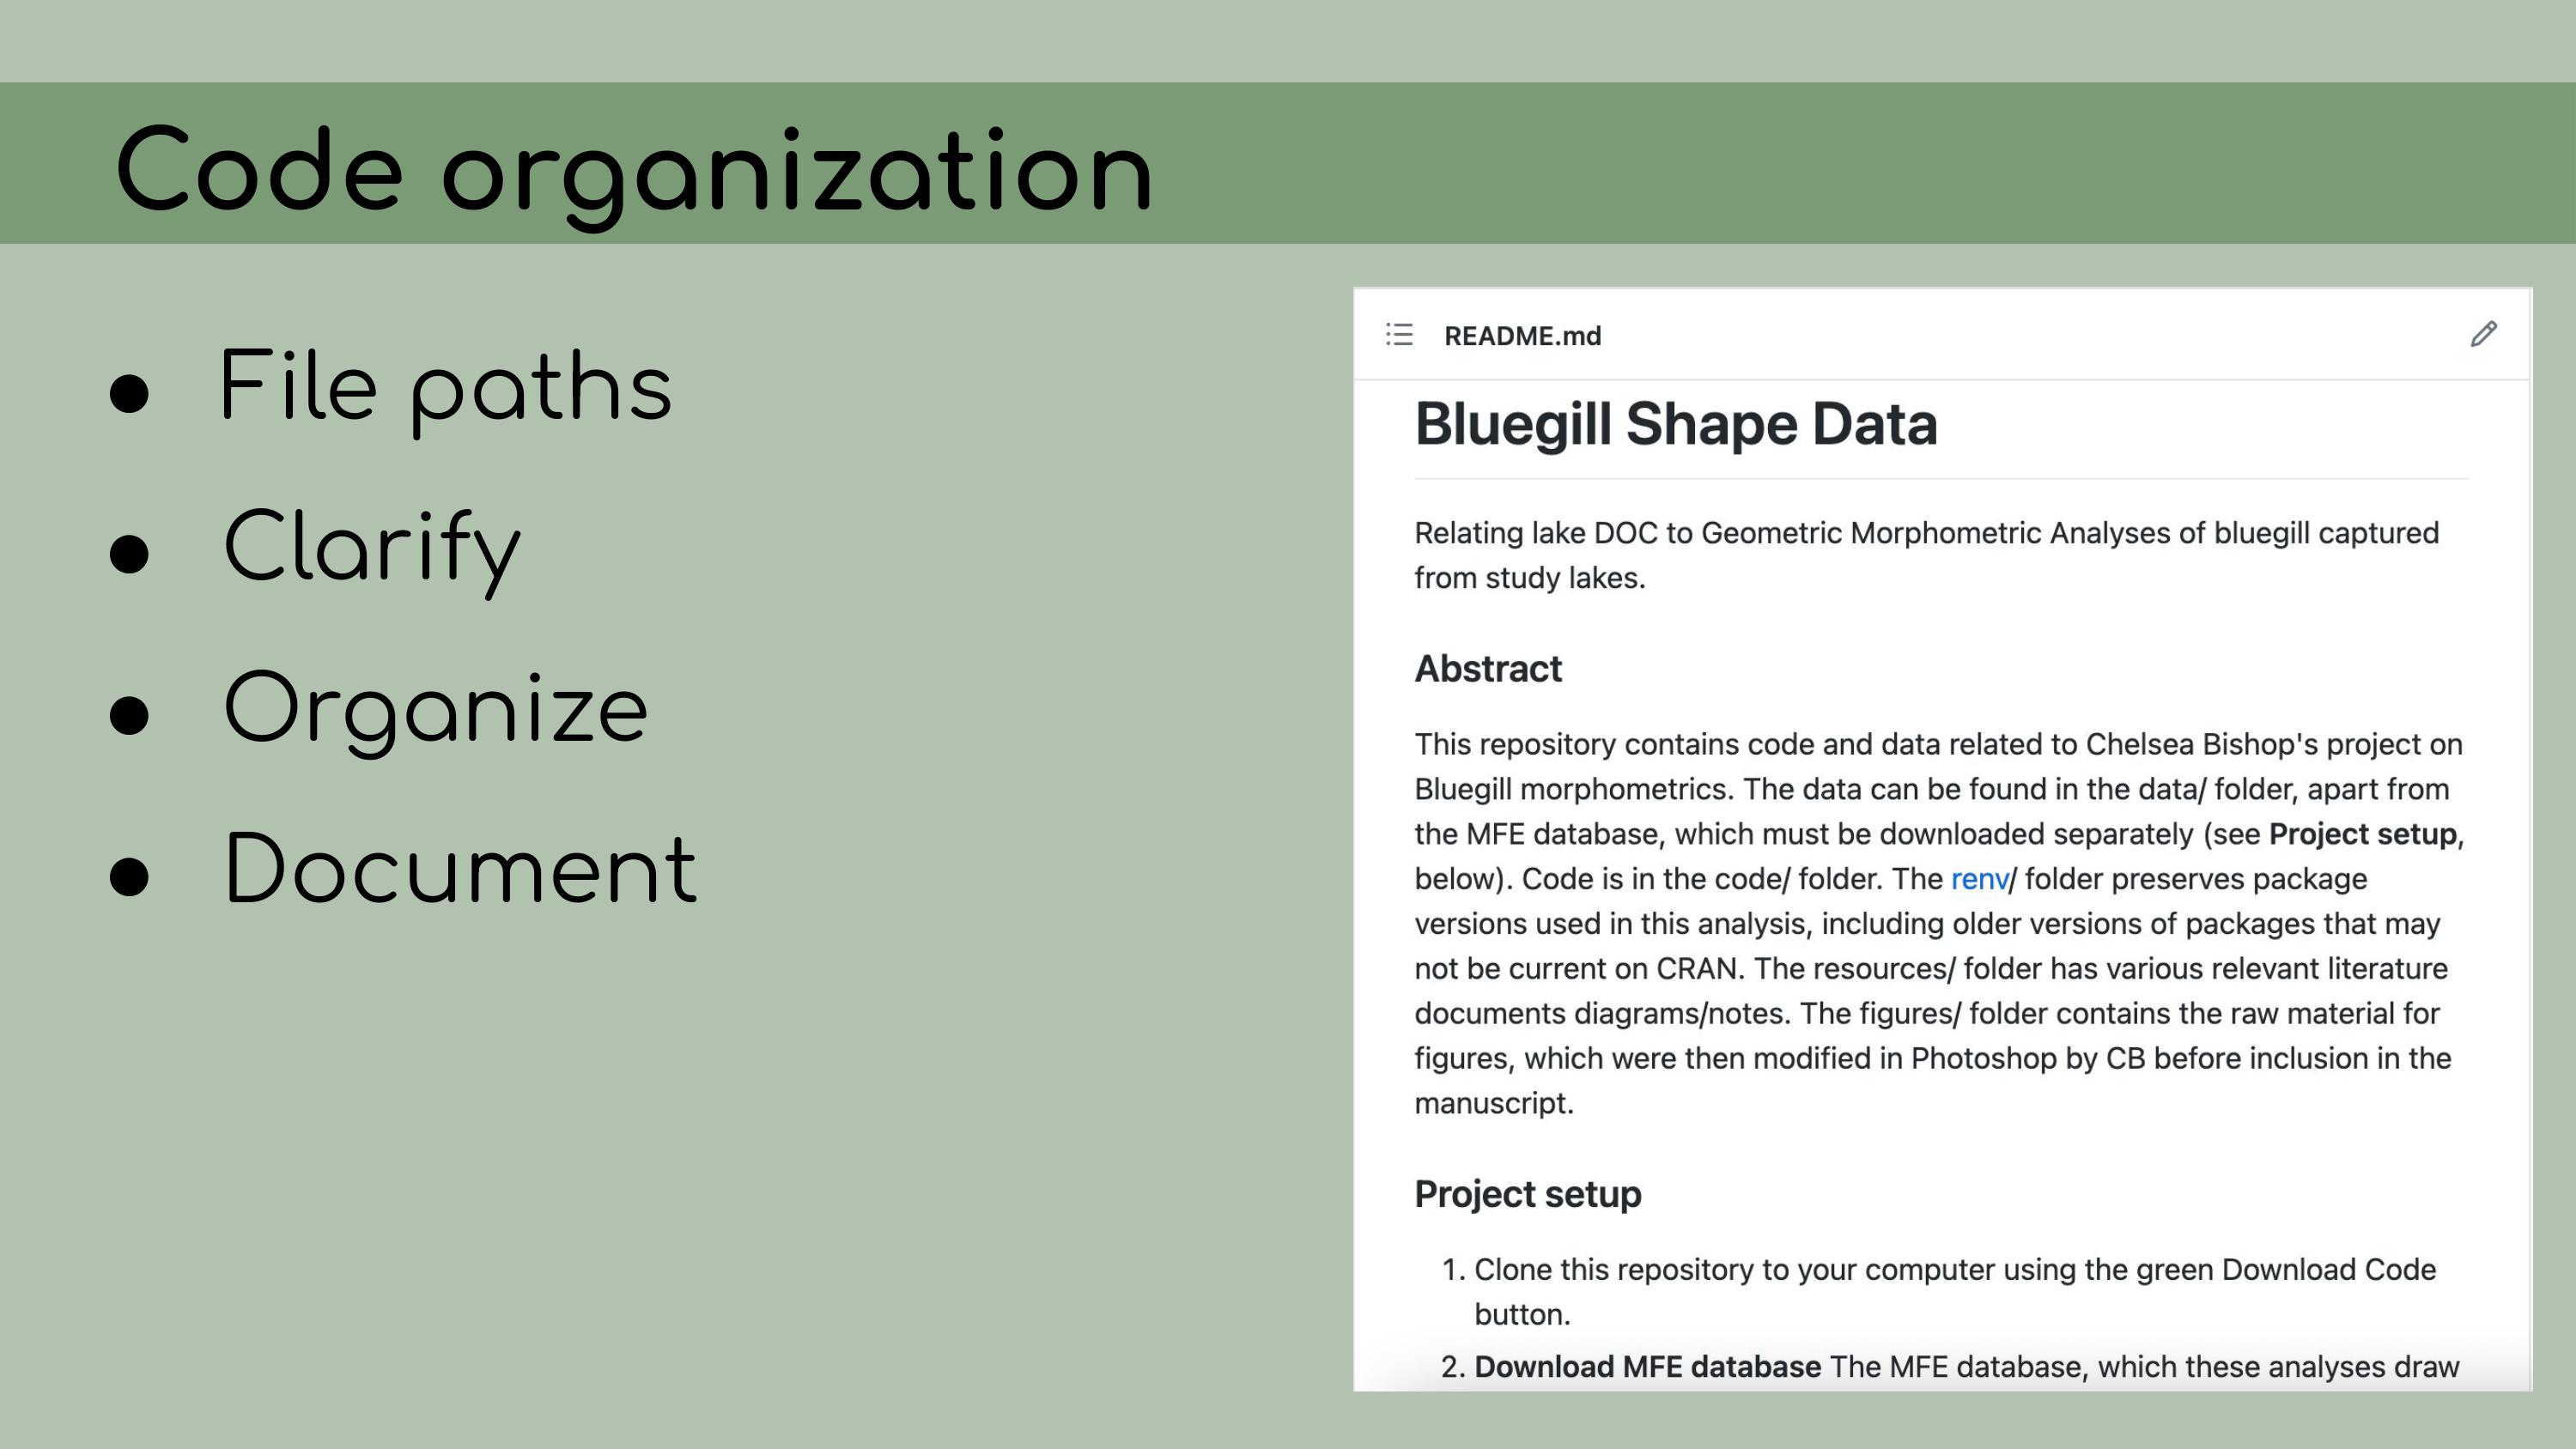 Then, I
could look at all of the data files that were read in as inputs. It was
much easier, with this reduced set of files, to
determine…
Then, I
could look at all of the data files that were read in as inputs. It was
much easier, with this reduced set of files, to
determine… …which ones
were raw data and which ones were derived data. So, my next step was,
for each of those derived data files, to figure out how to re-create it
from the data in the database, using R scripts, so that the process
would be fully reproducible.
…which ones
were raw data and which ones were derived data. So, my next step was,
for each of those derived data files, to figure out how to re-create it
from the data in the database, using R scripts, so that the process
would be fully reproducible.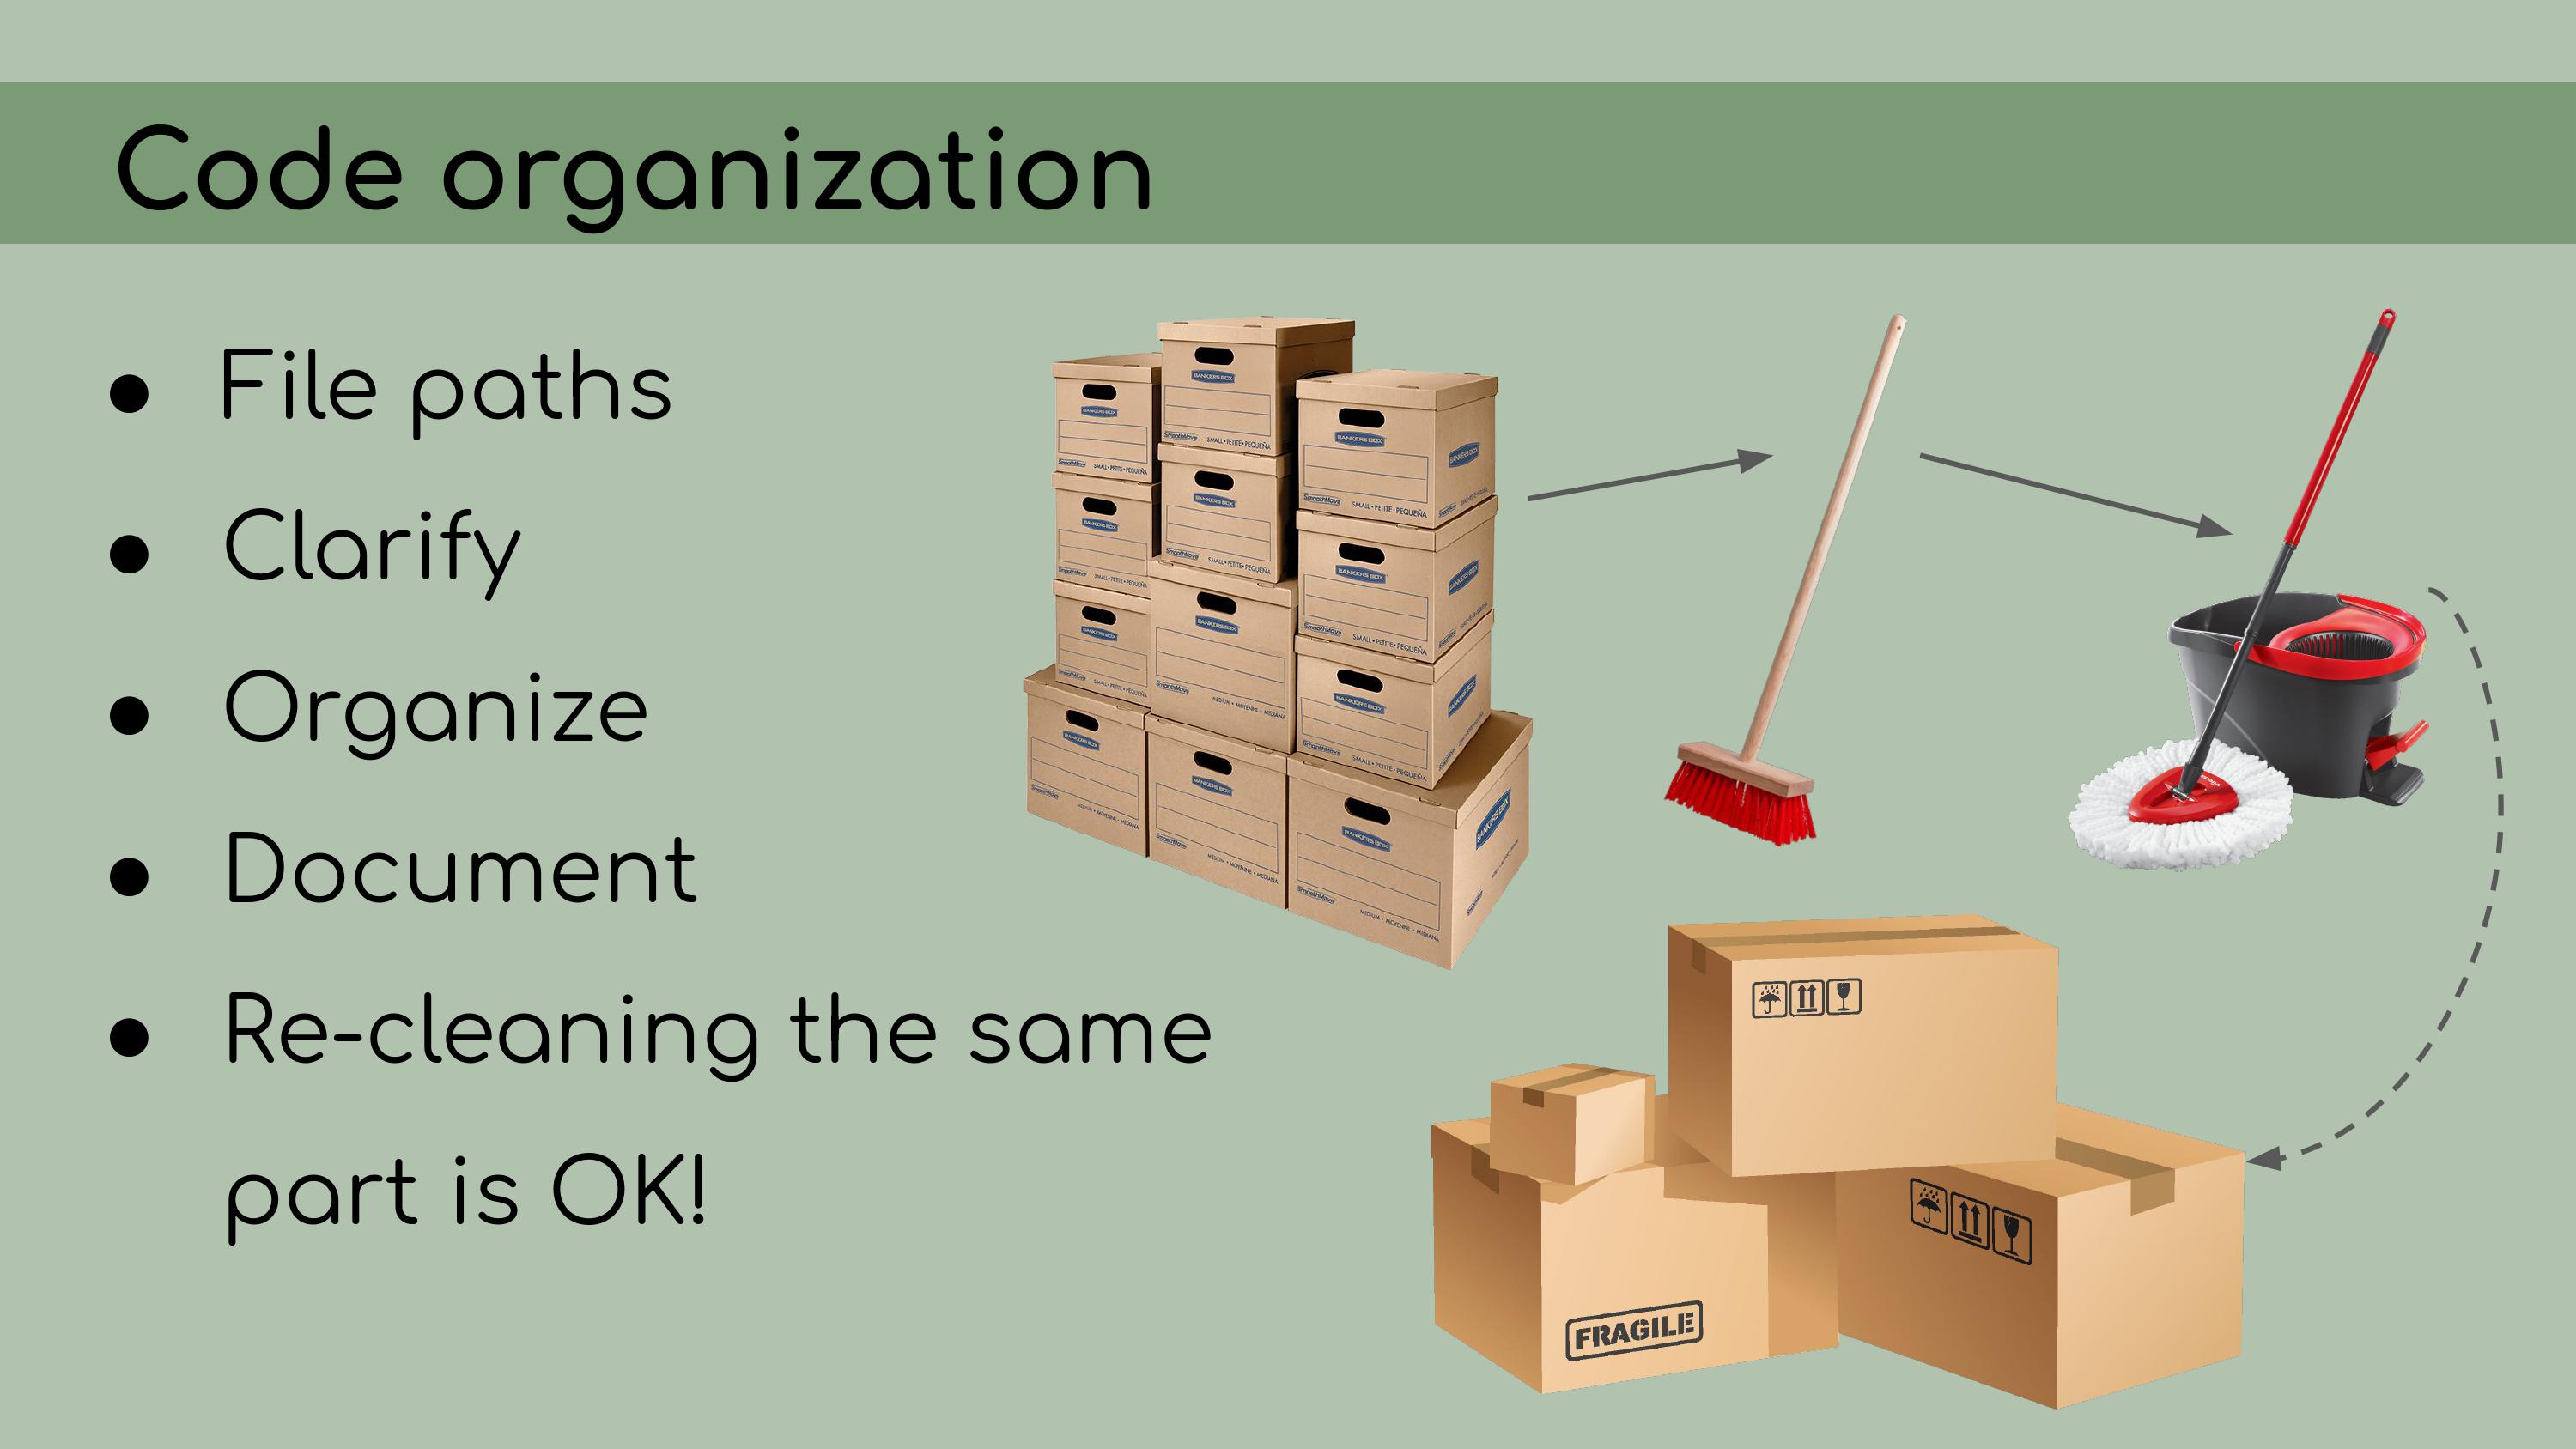 To do that, I created one R script for each
of the derived data files, and I used that R script to read in data from
the database stored on Figshare and modify it to generate these ‘FINAL’
csv files. In the background, I kept the original data and used it as a
comparison, just to make sure I was accurately recreating that original
data.
To do that, I created one R script for each
of the derived data files, and I used that R script to read in data from
the database stored on Figshare and modify it to generate these ‘FINAL’
csv files. In the background, I kept the original data and used it as a
comparison, just to make sure I was accurately recreating that original
data.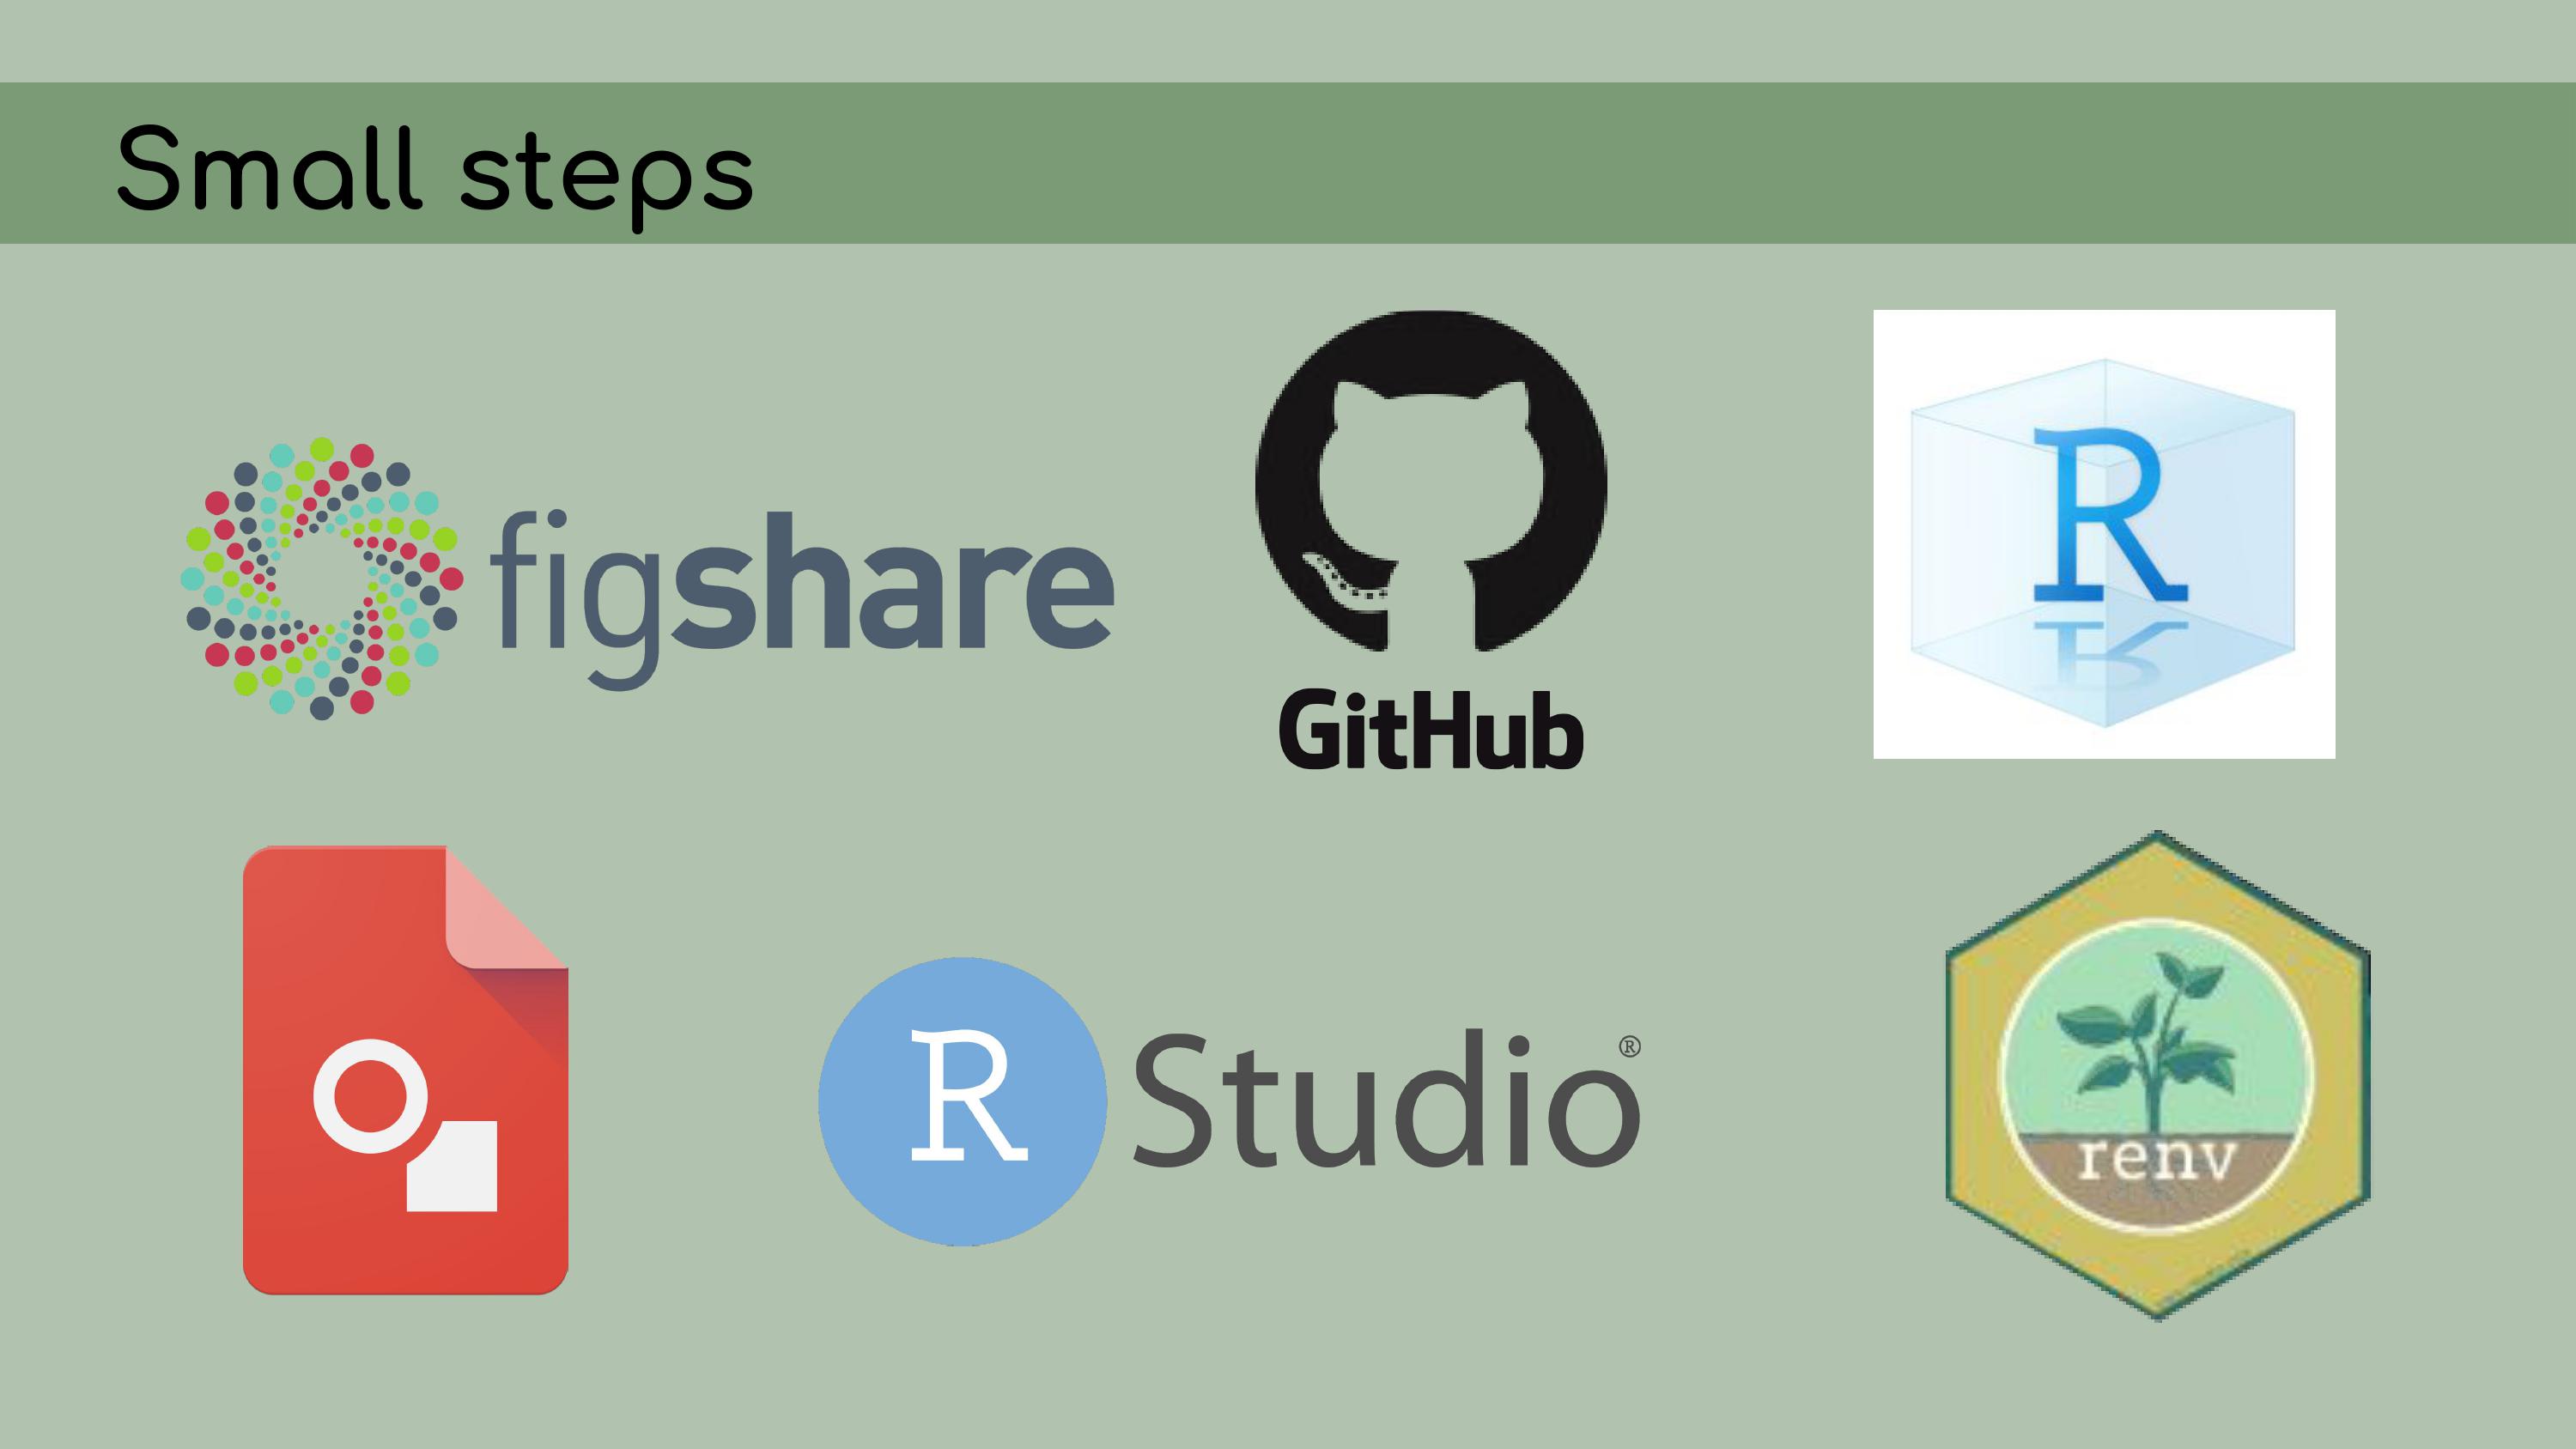 My next step was
to organize the code in the analysis files. I had to start by
reorganizing a lot of file paths; they had been written as absolute
paths, and I rewrote them as relative paths using the wonderful
My next step was
to organize the code in the analysis files. I had to start by
reorganizing a lot of file paths; they had been written as absolute
paths, and I rewrote them as relative paths using the wonderful
here package. I clarified a lot of the code by renaming
the variables with descriptive names and adding clear
comments.
I clarified a lot of the code by renaming
the variables with descriptive names and adding clear
comments. I also
organized the code to make sure it was easy to read and
follow.
I also
organized the code to make sure it was easy to read and
follow.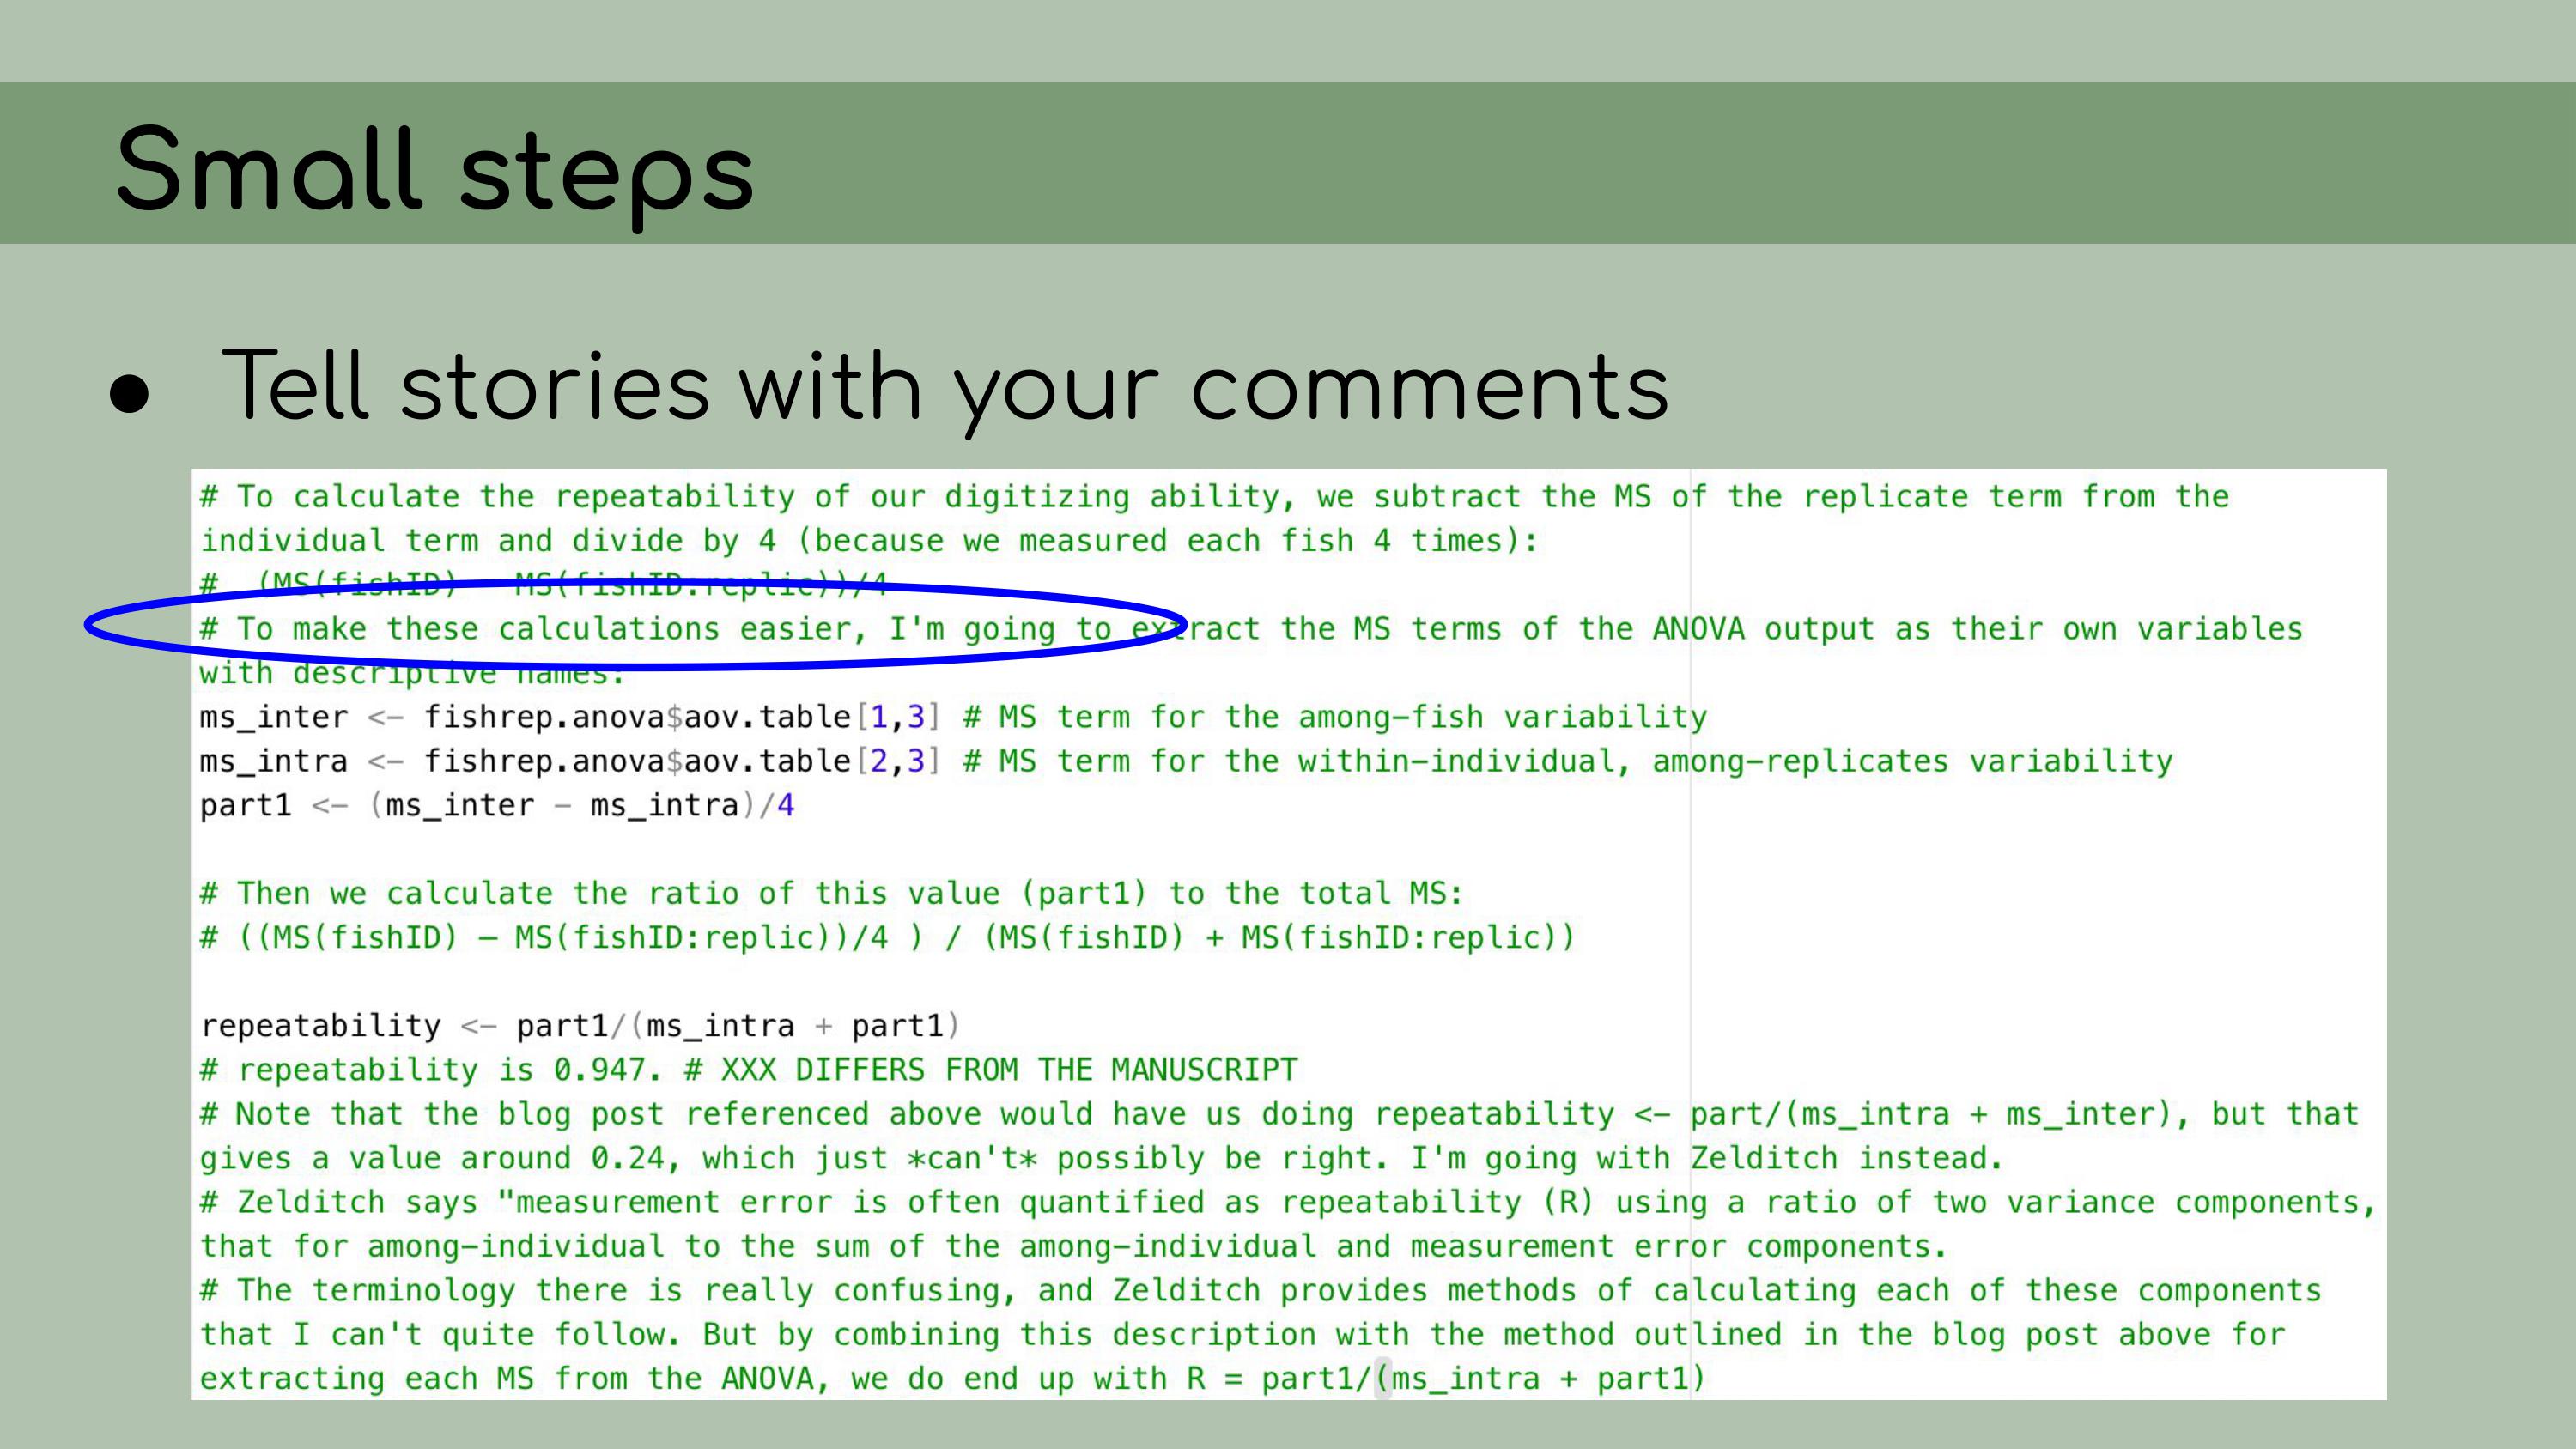 And to do that, I
made heavy use of the outline panel within RStudio, which you can access
by clicking on this sort of list icon at the top right corner of the
script pane.
And to do that, I
made heavy use of the outline panel within RStudio, which you can access
by clicking on this sort of list icon at the top right corner of the
script pane.
You’ll notice that this ‘Load packages’ header
corresponds to a line in this document outline, and that actually
happens automatically within RStudio. You can create these header lines by
clicking Command + Shift + R on a Mac, and they automatically get added
to the outlines.
You can create these header lines by
clicking Command + Shift + R on a Mac, and they automatically get added
to the outlines.
And then you can also see that I have a lot of
packages loaded at the top here, a lot of comments, and everything is
just a little bit cleaner and easier to read.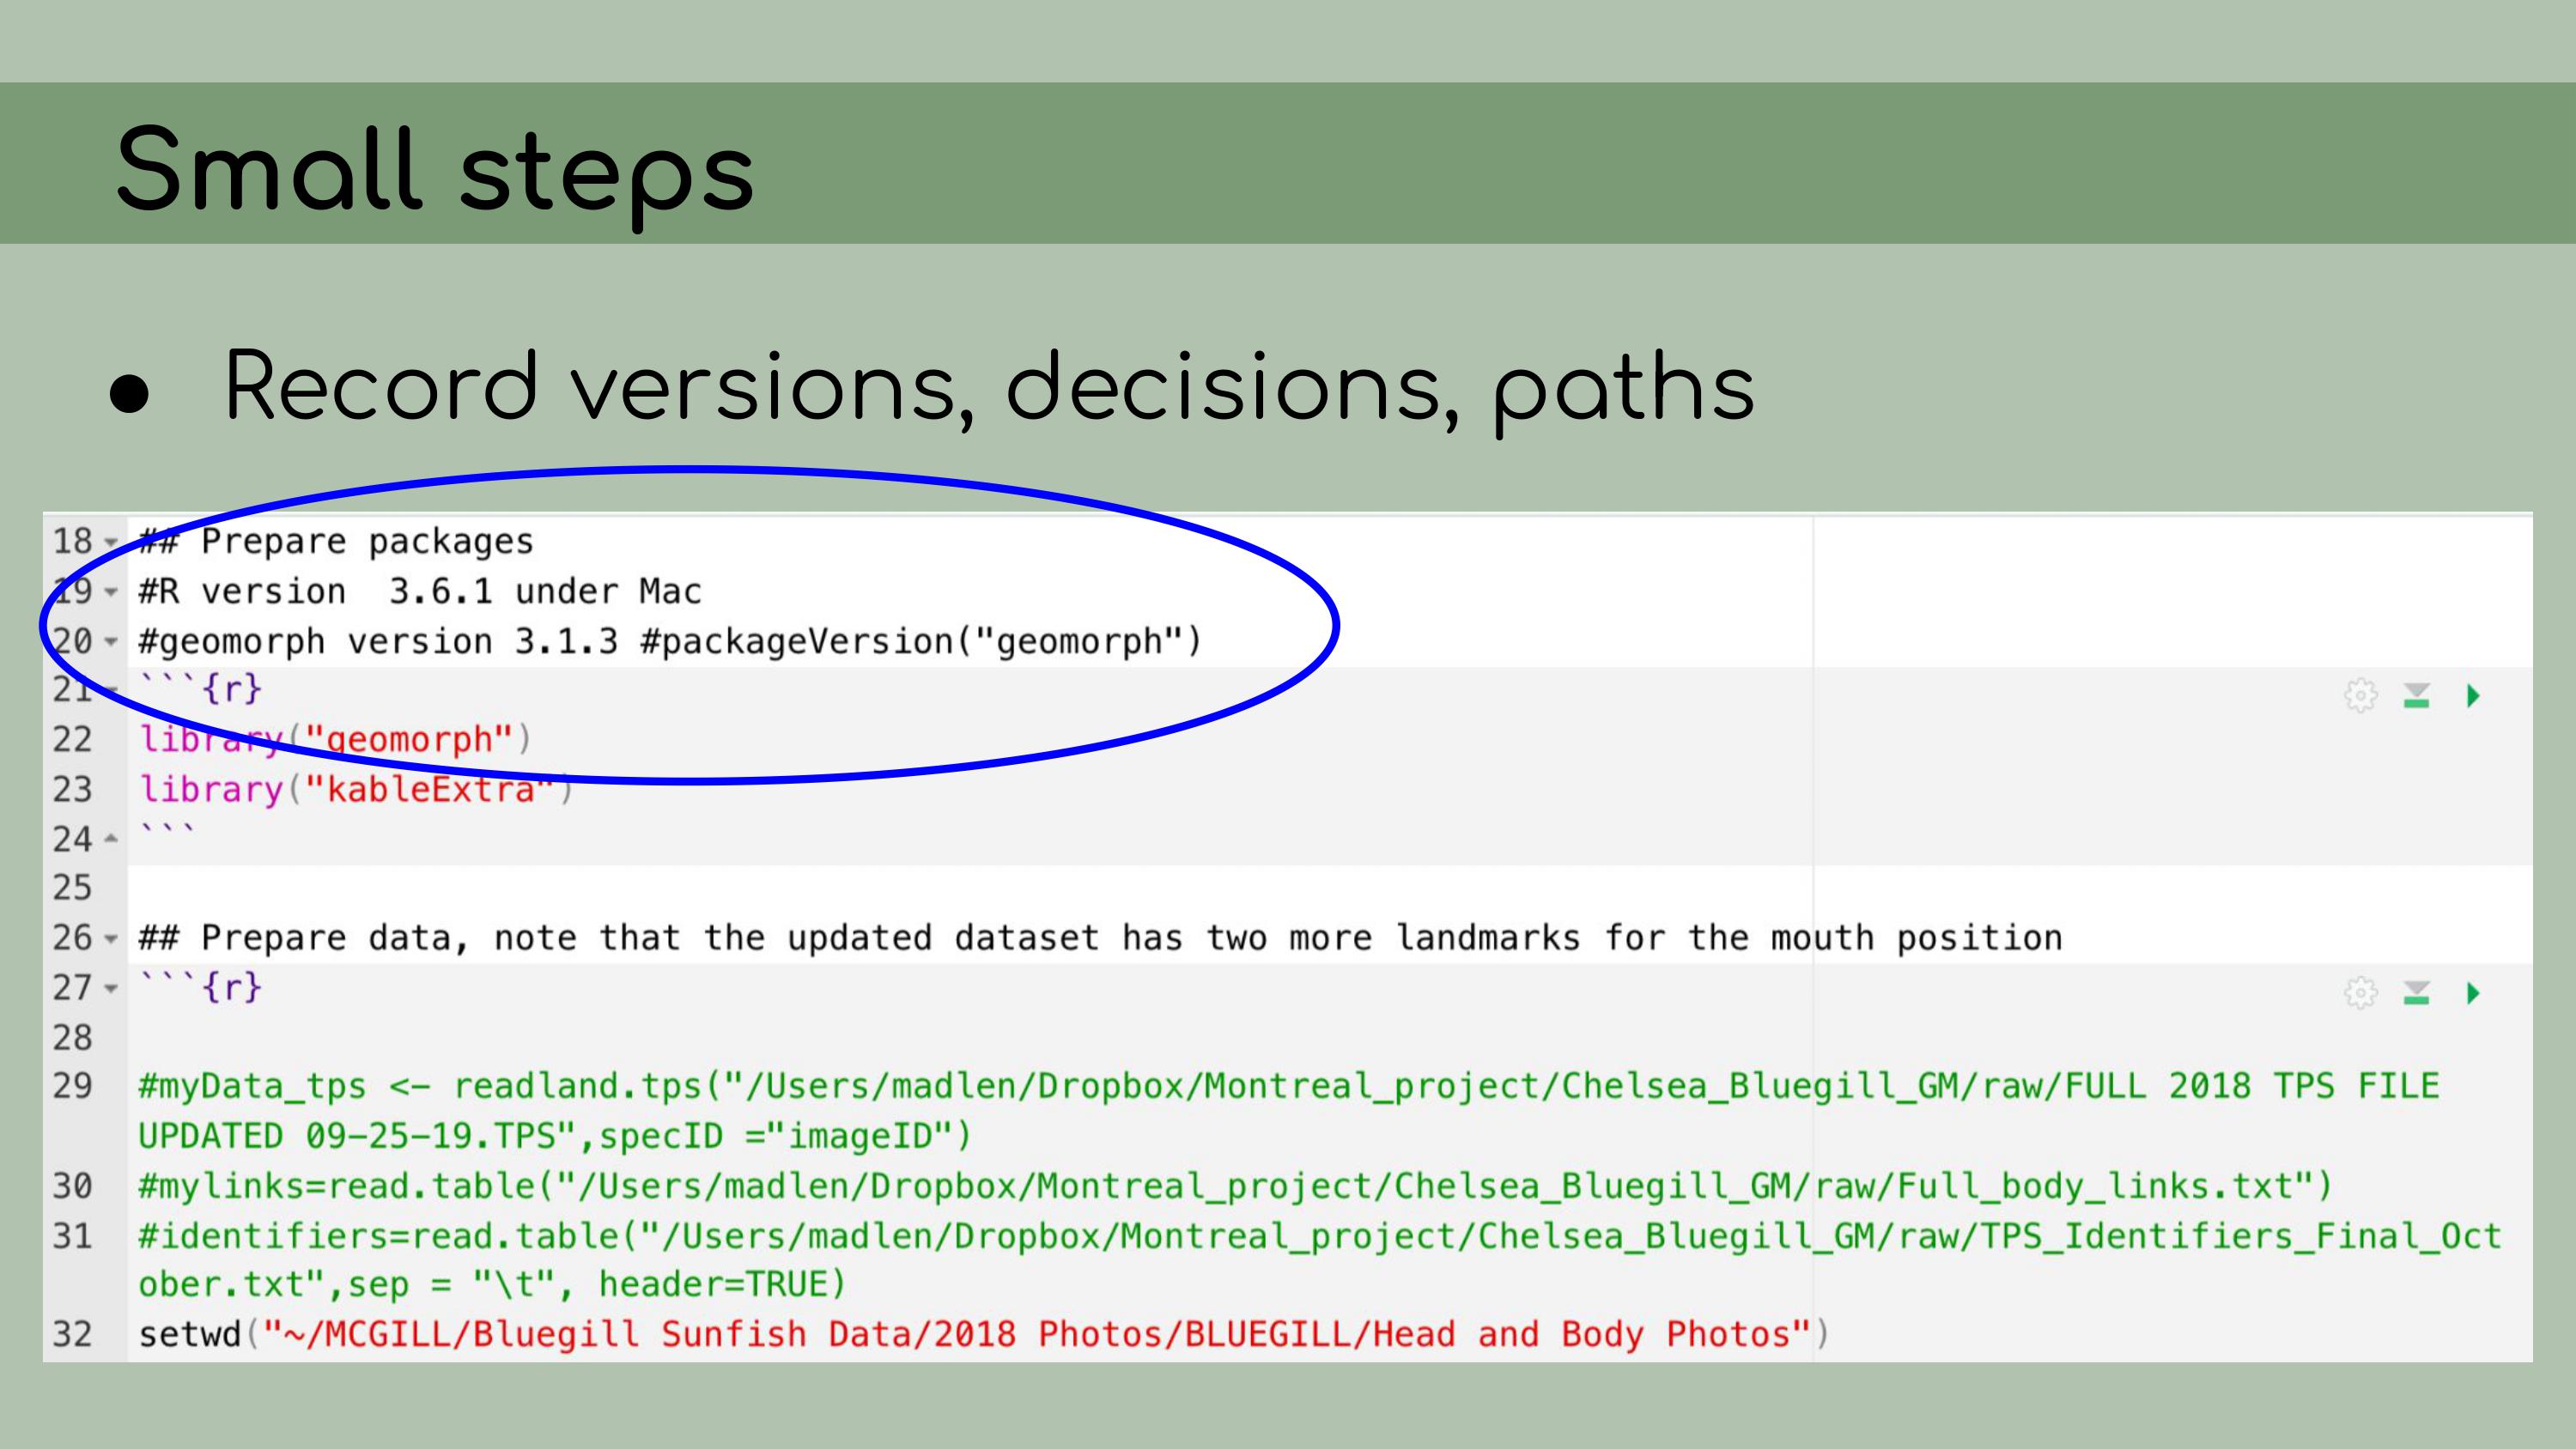 I wrote a README to document this project,
including an abstract to introduce people to the project, instructions
for how to download the data from Figshare and how to run the project,
restoring all the packages from the
I wrote a README to document this project,
including an abstract to introduce people to the project, instructions
for how to download the data from Figshare and how to run the project,
restoring all the packages from the renv lock file, and
also information about the contributors.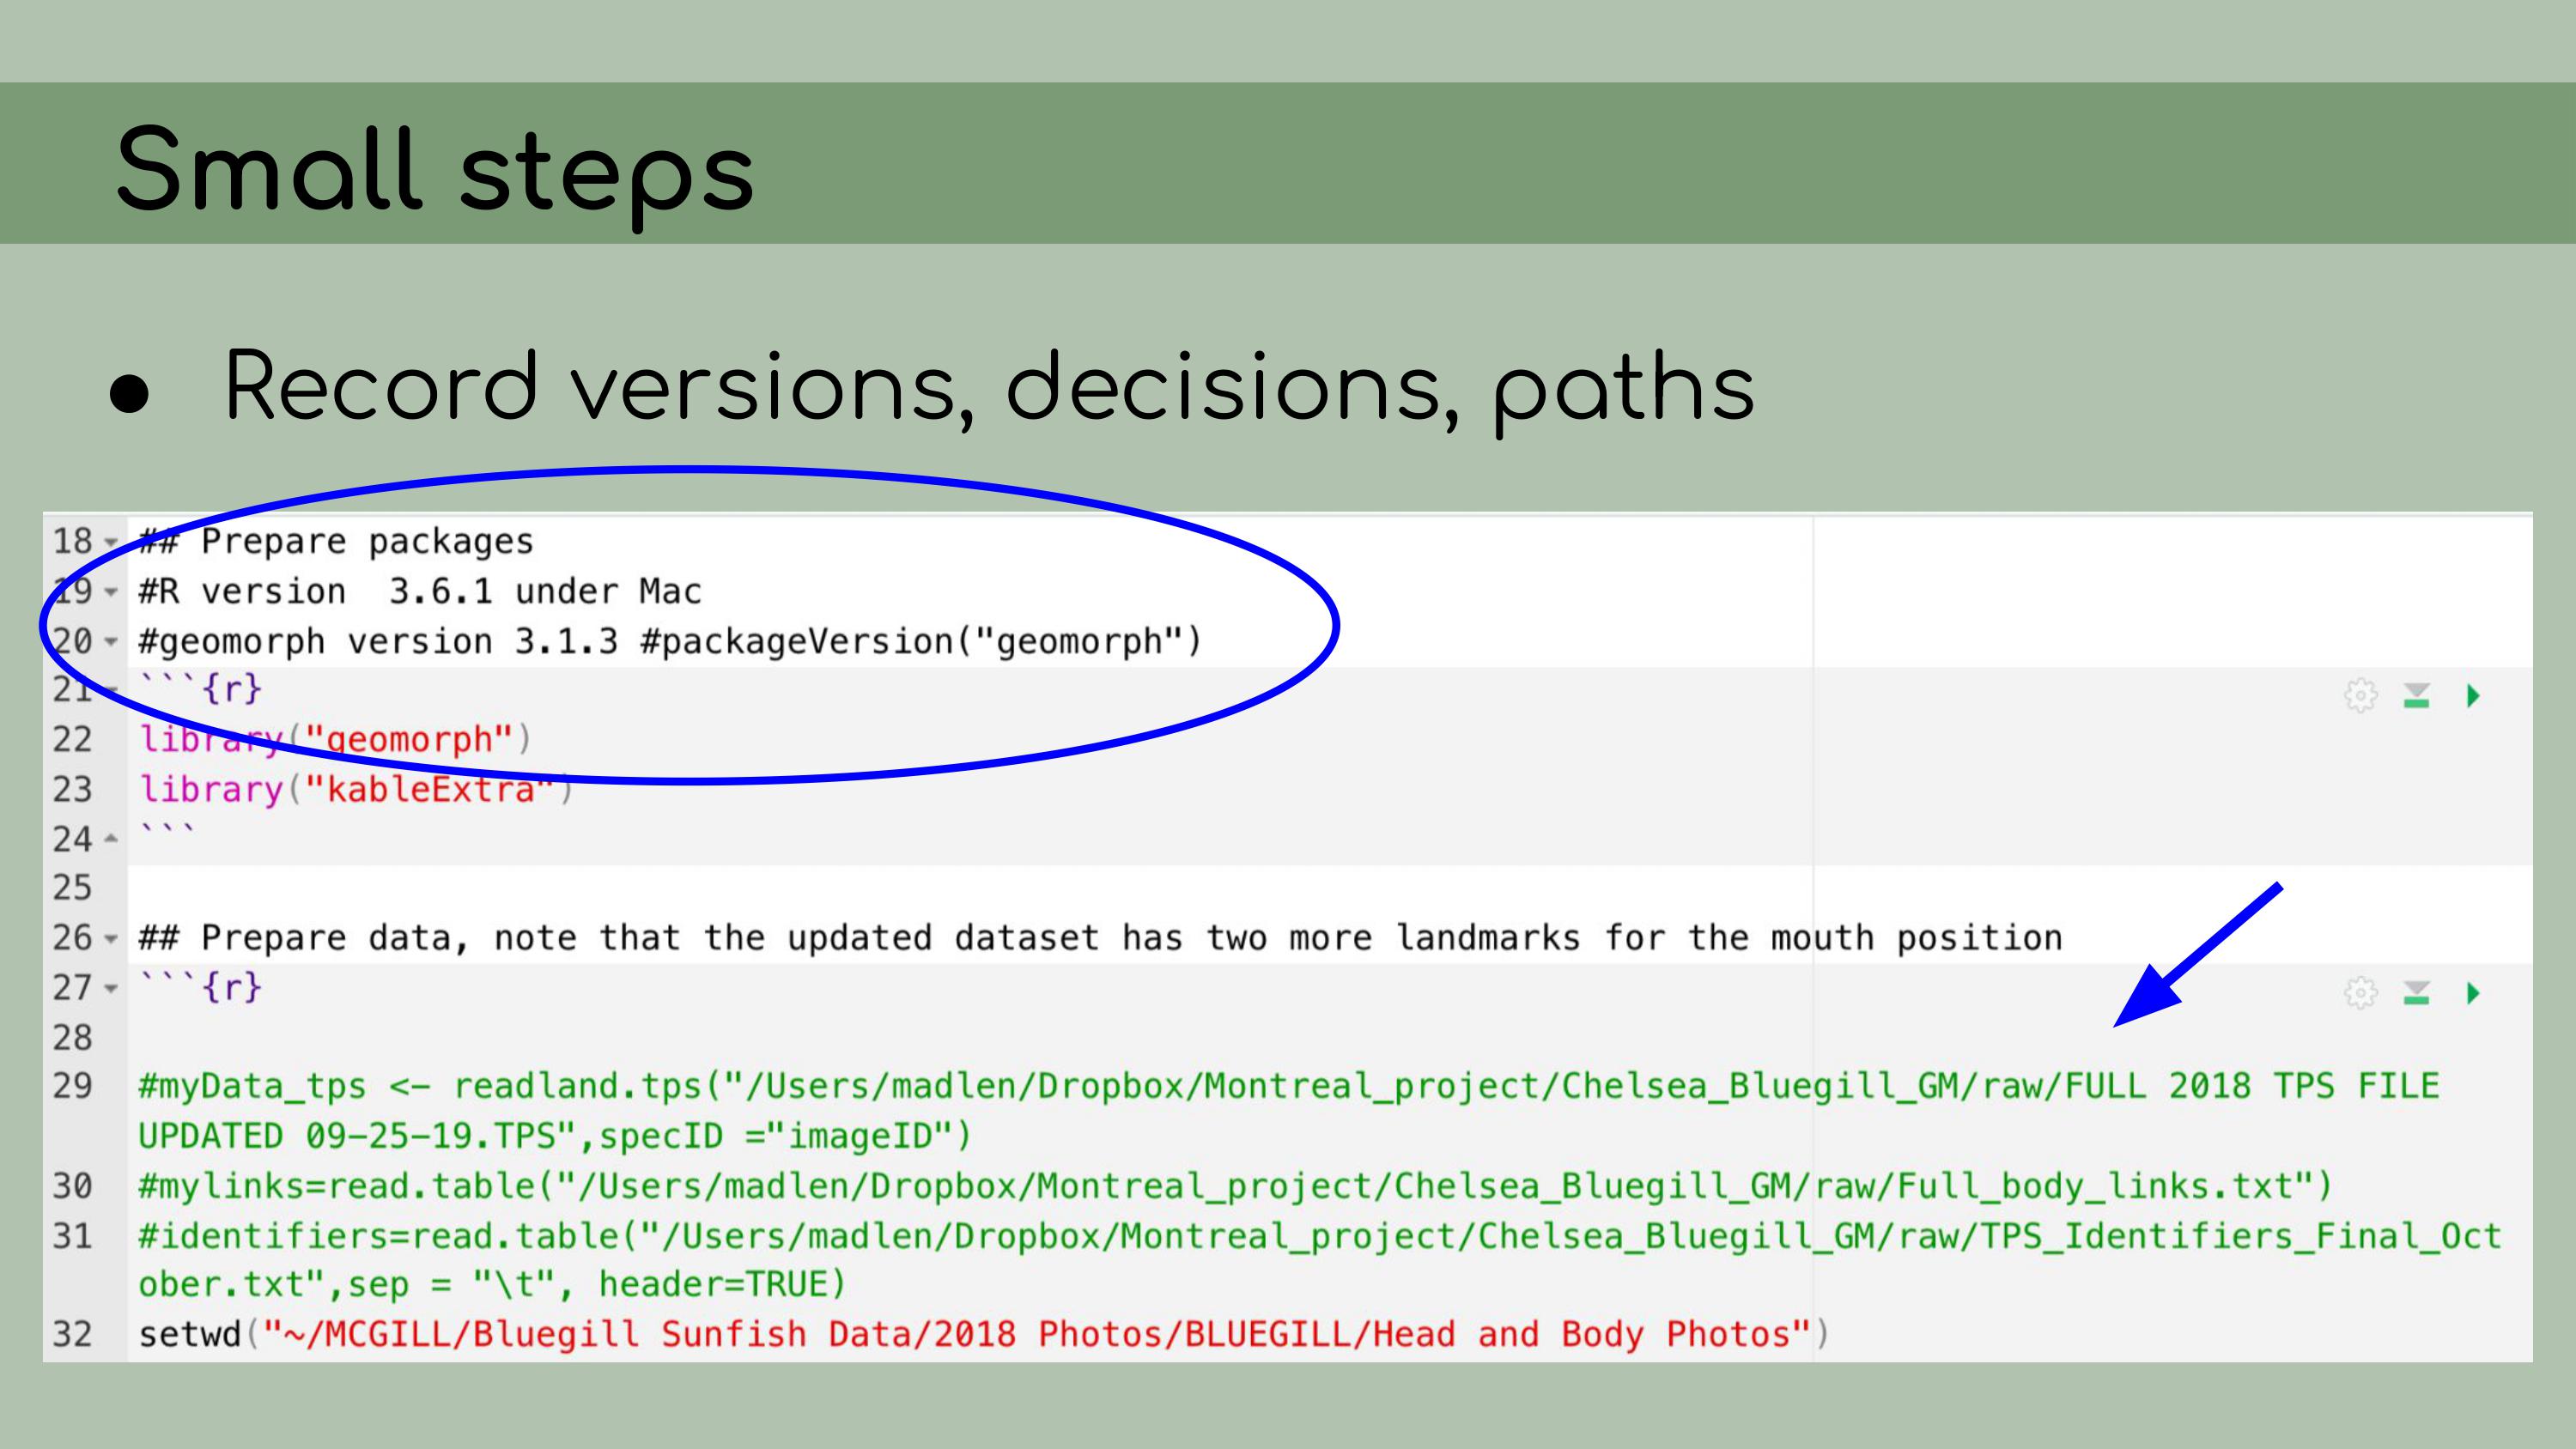 Finally, I wanted to emphasize that I
had to go over the same scripts multiple times, and sometimes doing a
first cleanup of the code helped me realize that reorganizing the code
in different way would actually be clearer, and so I ended up doing what
felt like the same work twice. I think that that re-tidying––it
shouldn’t be dismissed as being inefficient or not doing it right the
first time, because in my case, I had to take a lot of time to just get
my head around how the code was organized before I could make informed
decisions about how to clean it up.
Finally, I wanted to emphasize that I
had to go over the same scripts multiple times, and sometimes doing a
first cleanup of the code helped me realize that reorganizing the code
in different way would actually be clearer, and so I ended up doing what
felt like the same work twice. I think that that re-tidying––it
shouldn’t be dismissed as being inefficient or not doing it right the
first time, because in my case, I had to take a lot of time to just get
my head around how the code was organized before I could make informed
decisions about how to clean it up. So, I’ve talked about a lot of tools that I
used in creating this reproducible pipeline, from Figshare to RStudio
and RStudio Projects, GitHub for version control, Google Drawings in my
case for creating this flowchart, and
So, I’ve talked about a lot of tools that I
used in creating this reproducible pipeline, from Figshare to RStudio
and RStudio Projects, GitHub for version control, Google Drawings in my
case for creating this flowchart, and renv for organizing
packages. And this might be overwhelming if you’ve never used these
tools before and it feels like you have a lot of things to learn if you
want to start implementing reproducible workflows.
But I want to
emphasize that there are smaller things that you can do to move in the
right direction, even if you can’t jump right into using best practices
from the get-go.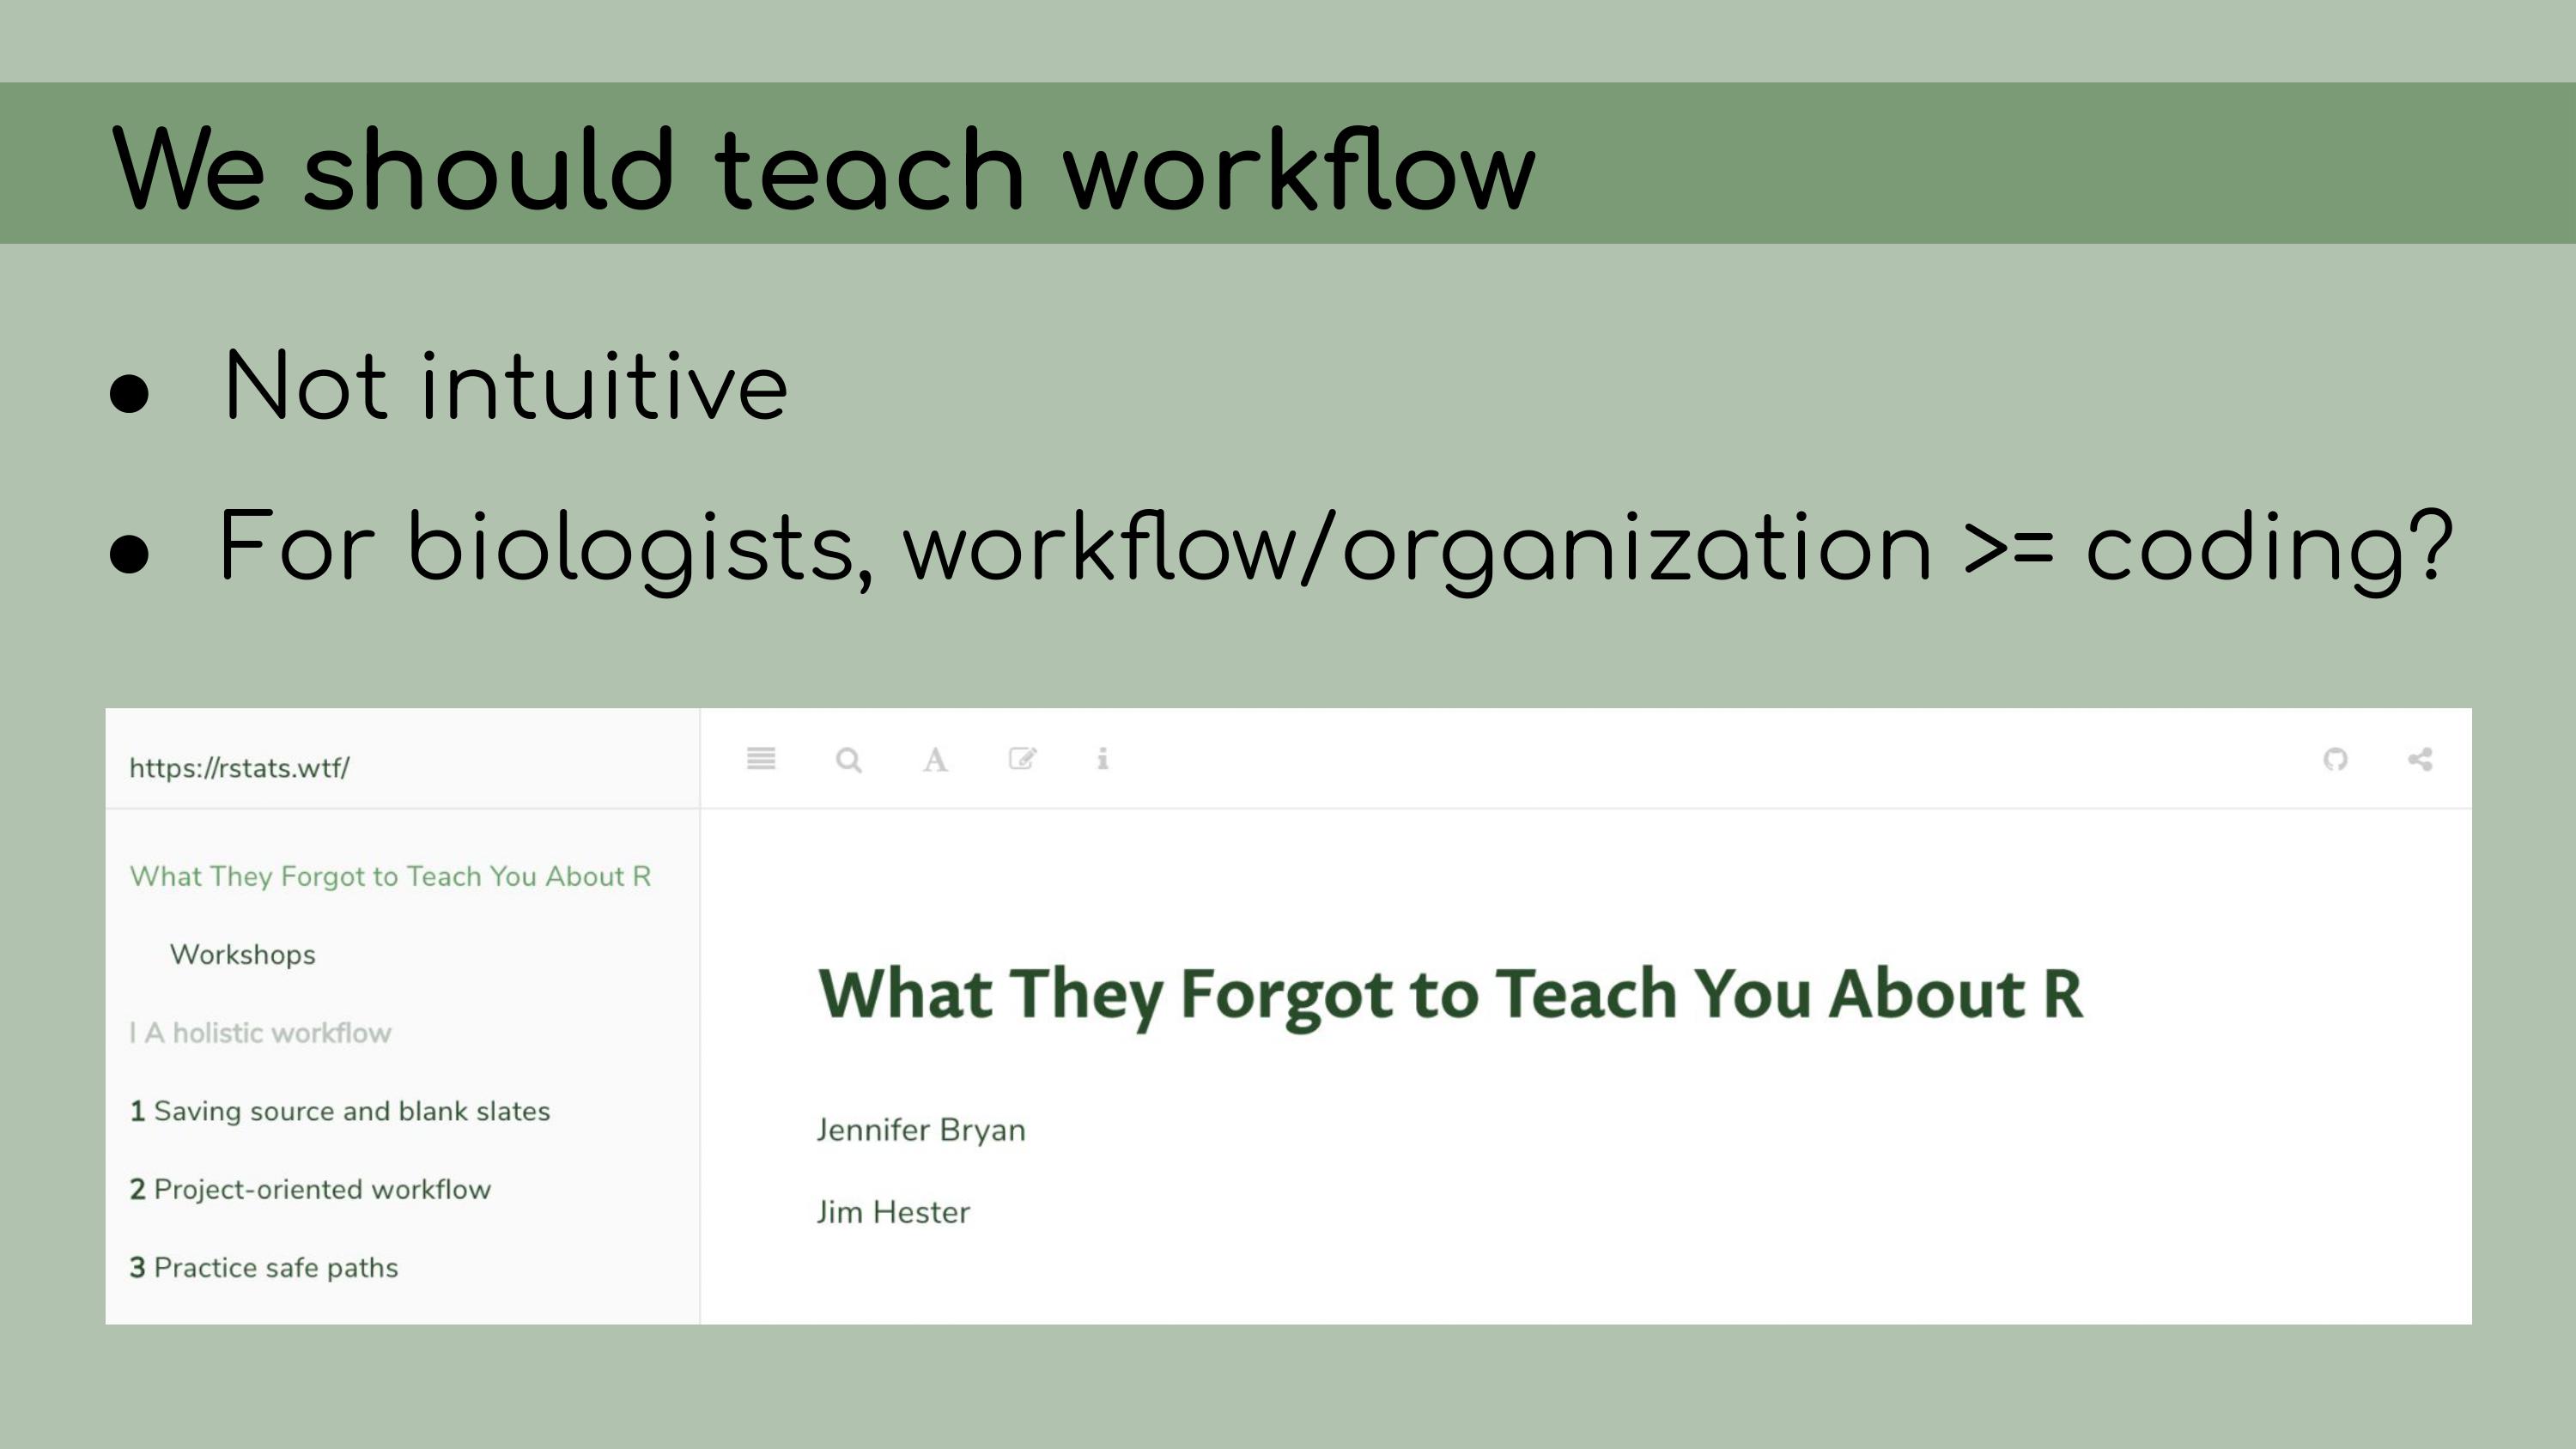 For
example, don’t be afraid to tell stories with your comments. I like to
be very conversational; I like to say ‘Okay, now we’re going to do X’,
‘I noticed this about the output, and that causes me to make this
decision about the model’
For
example, don’t be afraid to tell stories with your comments. I like to
be very conversational; I like to say ‘Okay, now we’re going to do X’,
‘I noticed this about the output, and that causes me to make this
decision about the model’
For example here, I wrote, ‘To make
these calculations easier, I’m going to….’ do XYZ, and then I have some
lines of code.
Now, you’ll notice here that I only have about
four lines of code, and a LOT of lines of comments, and not all of my
scripts look like that. But I just want to get the point across that
it’s really okay to write essays in your code and to have your code
comments be informal, conversational and very
descriptive. Something that
Chelsea did in her raw code files that I found very helpful when I went
through and organized them, was to keep track, in the comments, of
package versions and decisions that were made in the analyses, and file
paths. So for example, I already discussed how we had to use an older
version of the package
Something that
Chelsea did in her raw code files that I found very helpful when I went
through and organized them, was to keep track, in the comments, of
package versions and decisions that were made in the analyses, and file
paths. So for example, I already discussed how we had to use an older
version of the package geomorph, and conveniently, Chelsea
had recorded the version number of the older version that she was using,
so it was much easier for me to then restore that version when I started
using renv.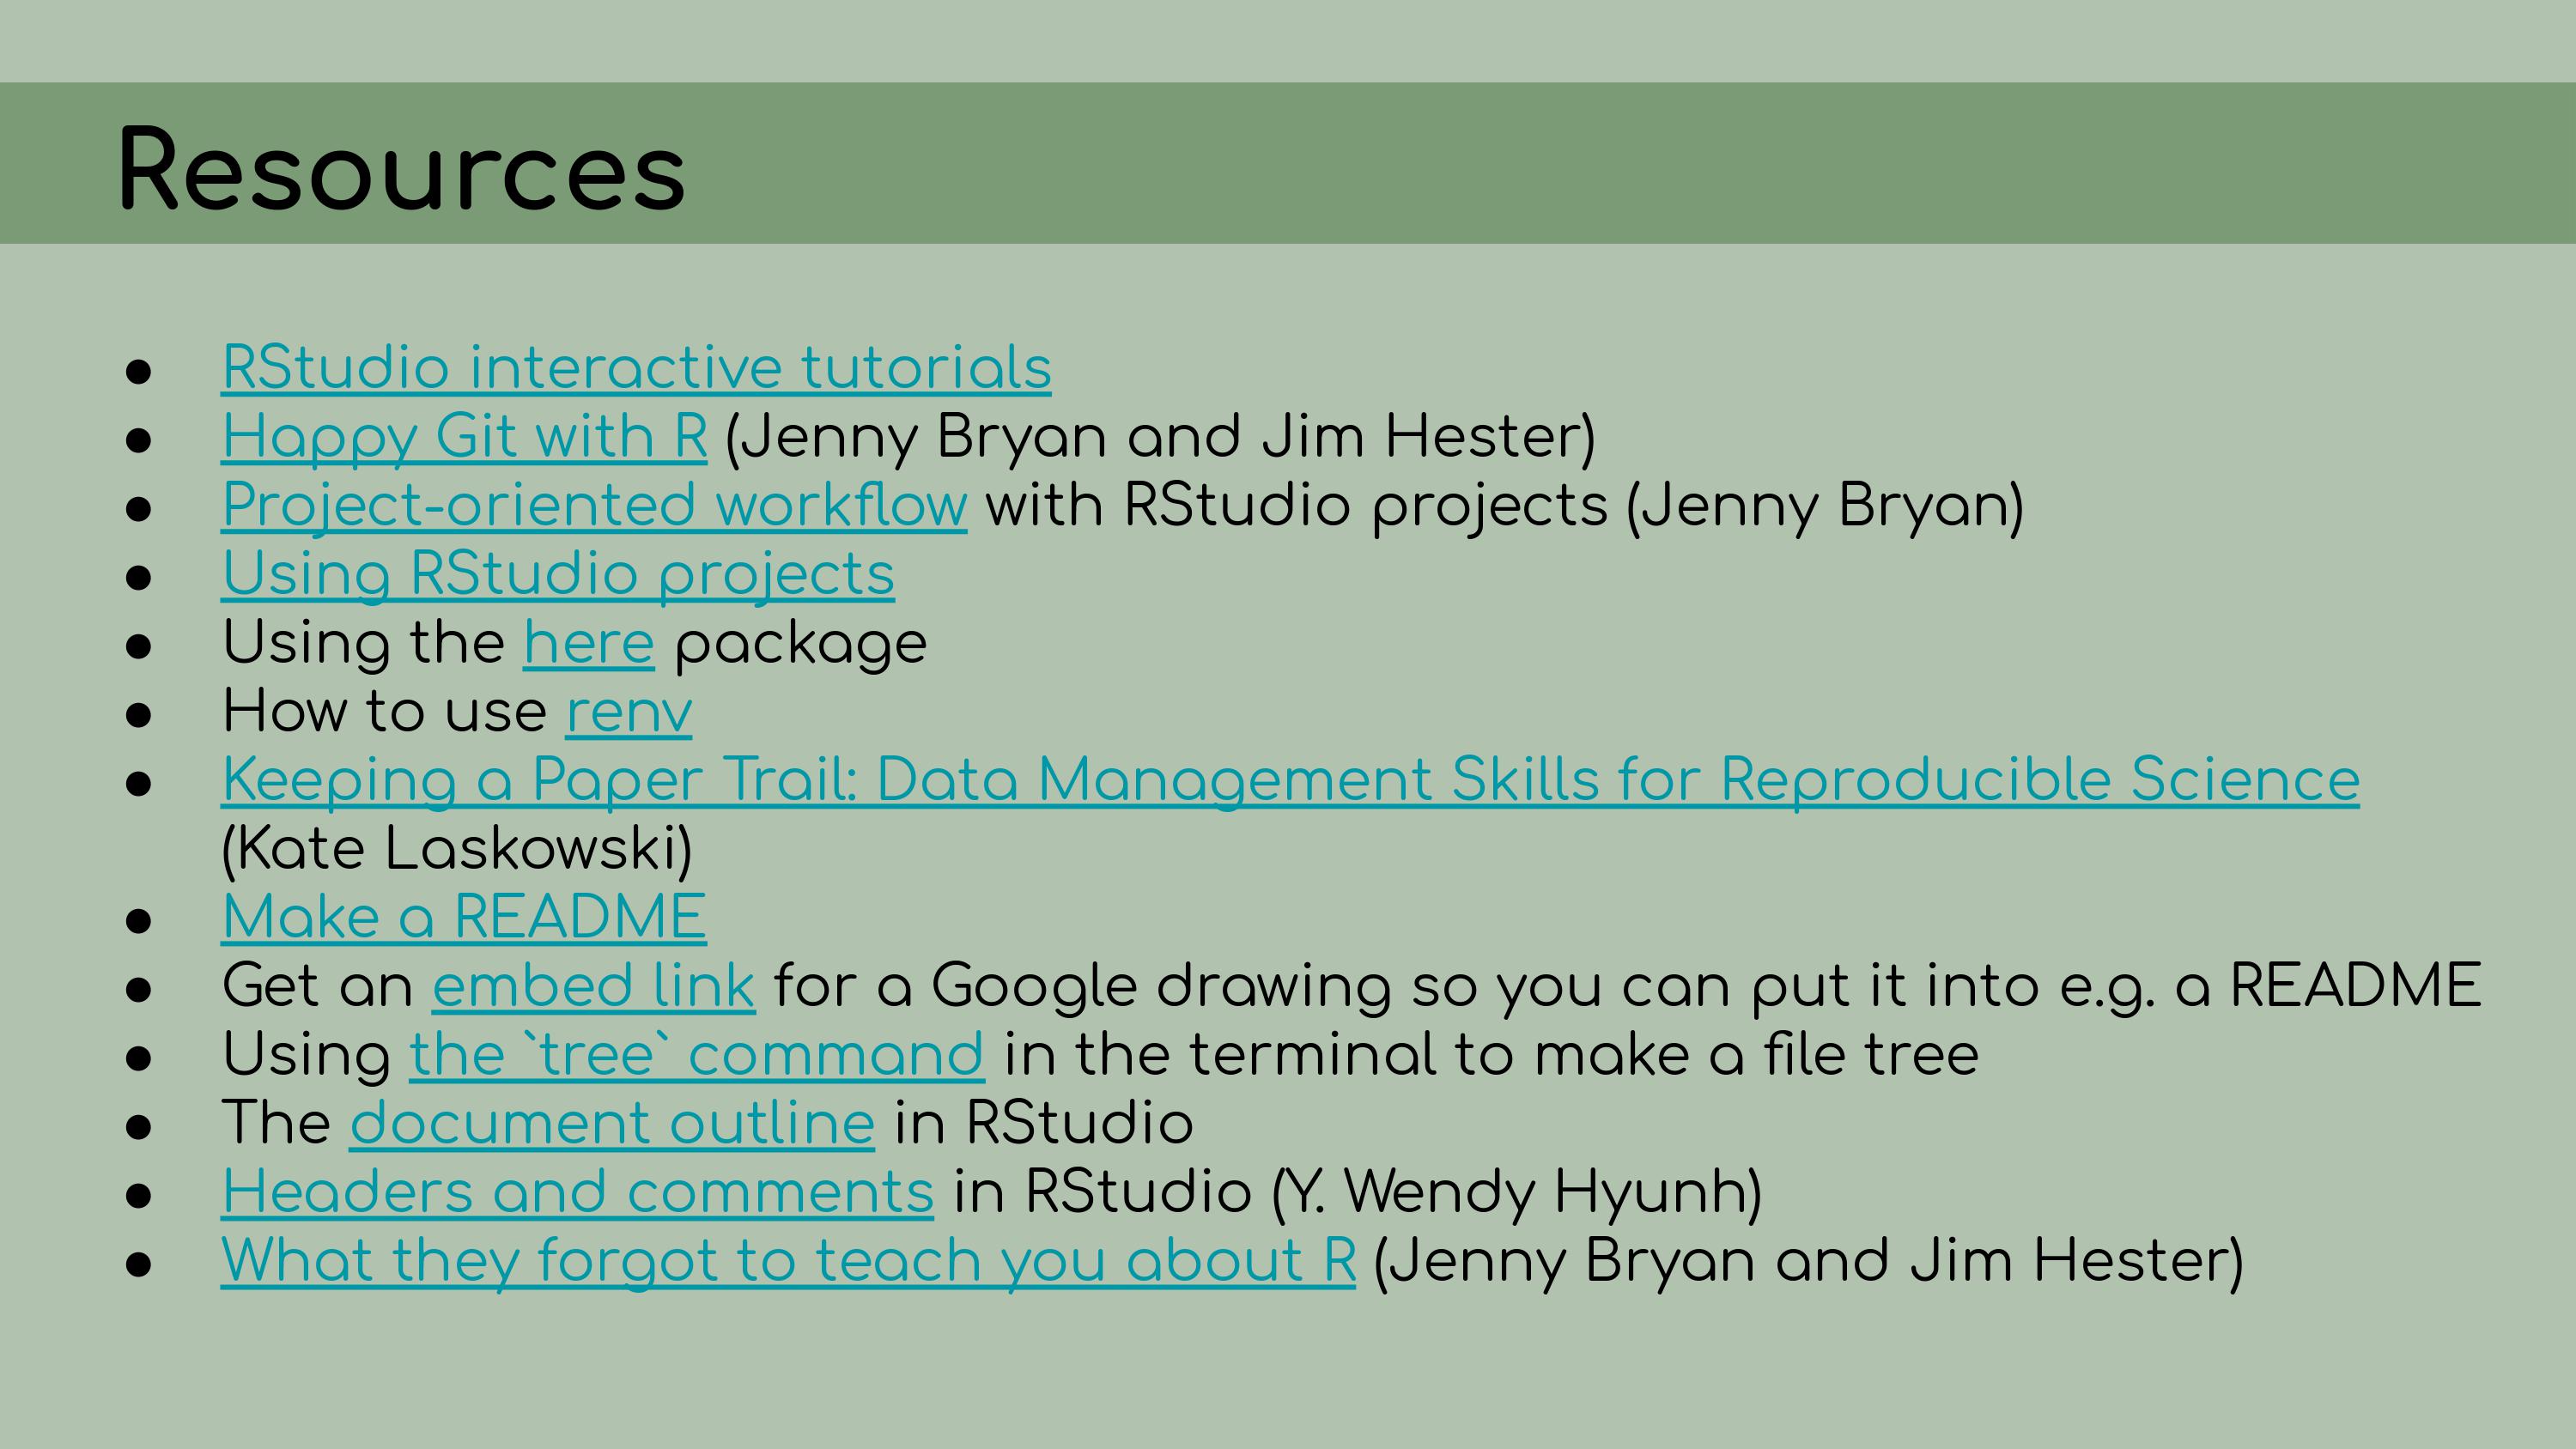 You’ll notice that this script is far
from being perfect; it’s still using absolute file paths, it hasn’t yet
been edited to use the
You’ll notice that this script is far
from being perfect; it’s still using absolute file paths, it hasn’t yet
been edited to use the here package, but even without using
all best practices in reproducibility, just having these introductory
comments is really helpful. I want to conclude this talk by just
emphasizing that we really need to teach workflow in graduate programs,
undergraduate programs, whenever we teach coding. I would argue that,
for biologists, workflow, organization, and reproducibility are some of
the things that take up the greatest proportion of our research time.
They are actually more valuable skills sometimes than the actual
statistical analysis. They are also not intuitive.
I want to conclude this talk by just
emphasizing that we really need to teach workflow in graduate programs,
undergraduate programs, whenever we teach coding. I would argue that,
for biologists, workflow, organization, and reproducibility are some of
the things that take up the greatest proportion of our research time.
They are actually more valuable skills sometimes than the actual
statistical analysis. They are also not intuitive.
I think it
can be easy, as a student, to assume that if you’re just an organized
person, you will magically know how to organize your code. And then it’s
easy to get frustrated when that doesn’t come naturally and when no one
has really taught you what the best practices are.
I think this
resource, written by Jenny Bryan and Jim Hester, ‘What they forgot to
teach you about R’, is a great example of this. This resource focuses on
a lot of the workflow tactics that I’ve been talking about here, like a
project-oriented workflow, and it’s titled ‘What they forgot to teach
you about R’. And I think for many students, that’s exactly true. They
do forget to teach you the workflow stuff, and that’s sometimes the most
important part. Here’s
a list of resources that I put together related to the various tools for
reproducibility that I’ve talked about in this
presentation
Here’s
a list of resources that I put together related to the various tools for
reproducibility that I’ve talked about in this
presentation And I would be
happy to take any questions at the Q&A session right after this
talk. Thank you very much.
And I would be
happy to take any questions at the Q&A session right after this
talk. Thank you very much.
Video
For the conference, I embedded captions in the video using iMovie, which was a pretty clunky process but was all I had access to at the time. There are some glitches and at one point I accidentally inserted the caption for a previous slide. On the whole, I hope the captions are better than nothing.
Resources
The resource links from the second to last slide didn’t translate well to this format, so here they are:
Happy Git with R (Jenny Bryan and Jim Hester)
Project-oriented workflow with RStudio projects (Jenny Bryan)
Using the here package
How to use renv
Keeping a Paper Trail: Data Management Skills for Reproducible Science(Kate Laskowski)
Get an embed link for a Google drawing so you can put it into e.g. a README
Using the `tree` command in the terminal to make a file tree
The document outline in RStudio
Headers and comments in RStudio (Y. Wendy Hyunh)
What they forgot to teach you about R (Jenny Bryan and Jim Hester)
Finally, you can download the video and the annotated slides from OSF here.