Problem
Making graphics with base R is annoying for many reasons, but a big one is having to type the name of the data frame over and over again to reference different columns.
Context
Back to our Mississippi River fish data. I’ve aggregated my sampling points into polygons, and now I want to explore some of their characteristics. To do that, I’d like to make some tables and plots, and because these are just quick, exploratory plots, I don’t feel like dealing with ggplot.
Load in the data (accessible on GitHub).
# Load data from GitHub
polygon <- read.csv("https://tinyurl.com/rta6hkbo")

# Look at what we're dealing with
dim(polygon) # How big is the data set?
[1] 527 21head(polygon, 3) # Look at the first few rows
poly_id propsnag n_points habitat_code pool Area Perimeter
1 P04_CFL_13 0.8000 5 CFL 4 105288.80 2067.890
2 P04_CFL_14 0.2000 5 CFL 4 42668.28 1770.465
3 P04_CFL_15 0.4375 16 CFL 4 678390.21 5226.963
max_depth avg_depth tot_vol shoreline_density_index pct_aqveg
1 1.30 0.3625869 33955 1.797759 19.133960
2 0.74 0.3291391 5953 2.417852 41.252704
3 2.68 0.6159651 356757 1.790213 9.256465
pct_terr pct_prm_wetf med_dist_to_land med_dist_to_forest
1 93.87983 79.67522 34.13379 34.13379
2 94.76871 42.44244 18.90166 32.64112
3 86.17161 41.27248 21.40210 39.27576
med_current wingdam revetment tributary pct_shallow_area
1 0.02 0 1 0 0.9278354
2 0.02 0 0 0 1.0000000
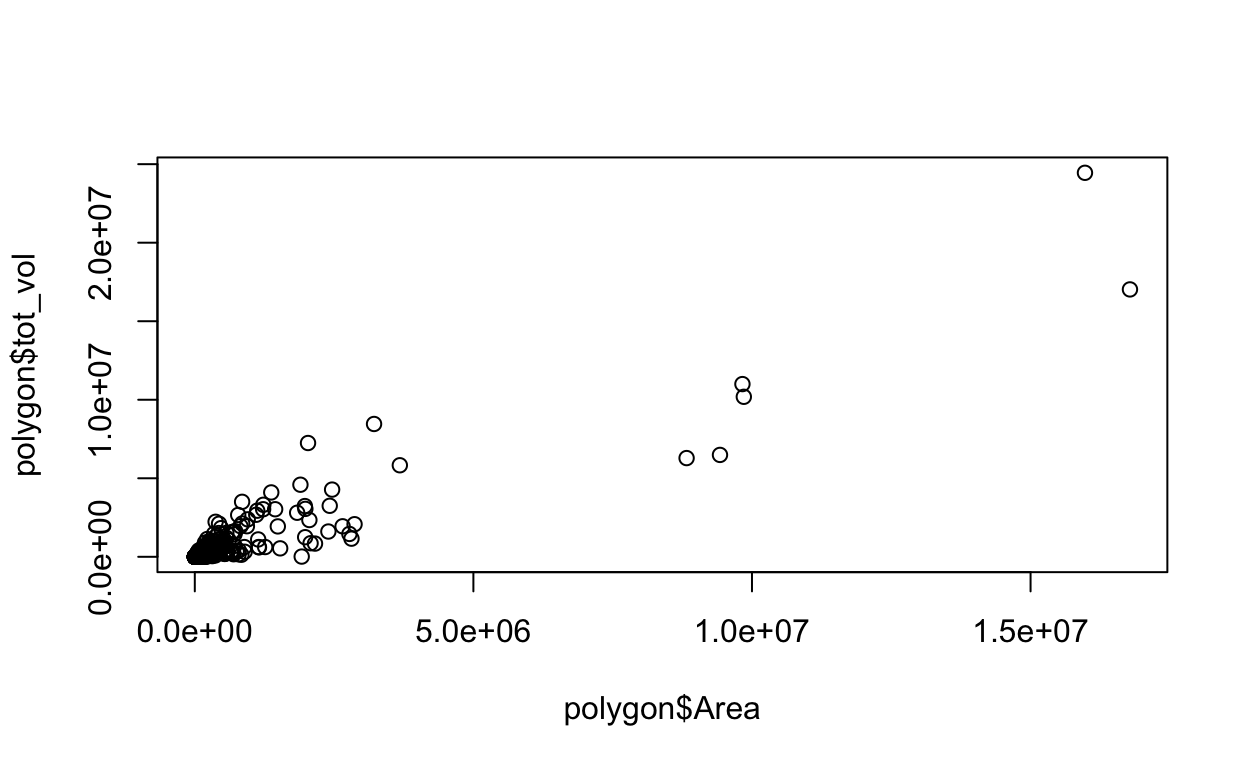
3 0.01 1 1 1 0.9194788First, I’d like to see how total volume tot_vol of the aquatic area scales with its Area.
In base R:
Either way, we get this:
Or a more informative plot, with both variables on a log scale:
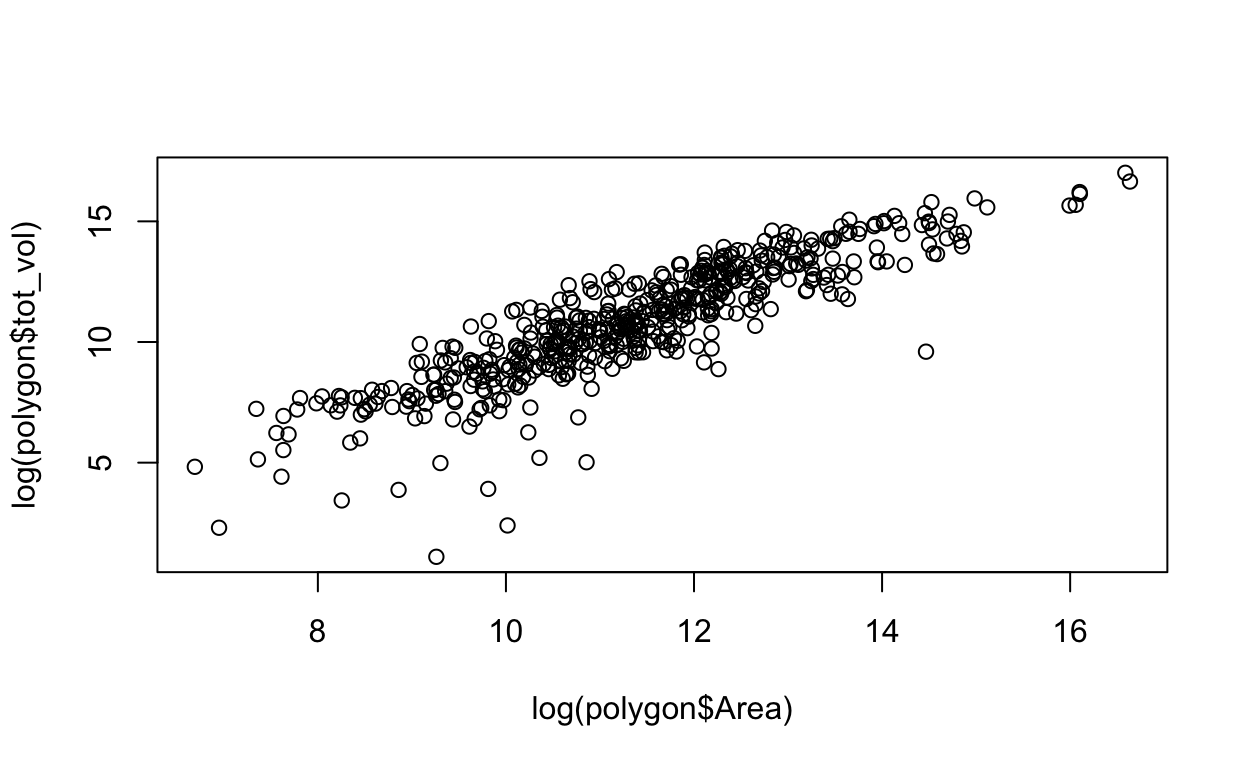
This isn’t too too clunky, but if the data frame name or column names are long, it can get a little annoying.
Solution
The with() function allows you to specify the data frame your variables are coming from and then reference the variables with respect to the data frame, similar to the ggplot argument data =. Handy.
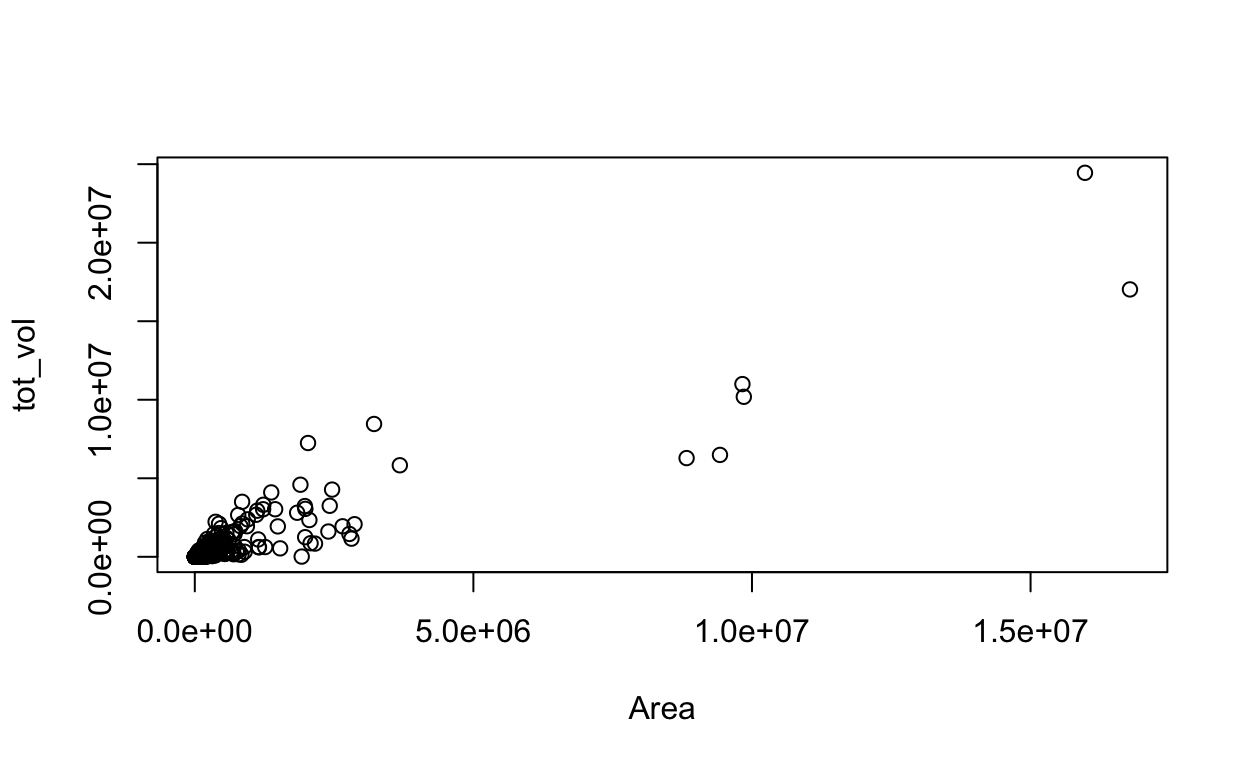
You can add any other arguments inside of the function, as normal, it’s just now wrapped in with().
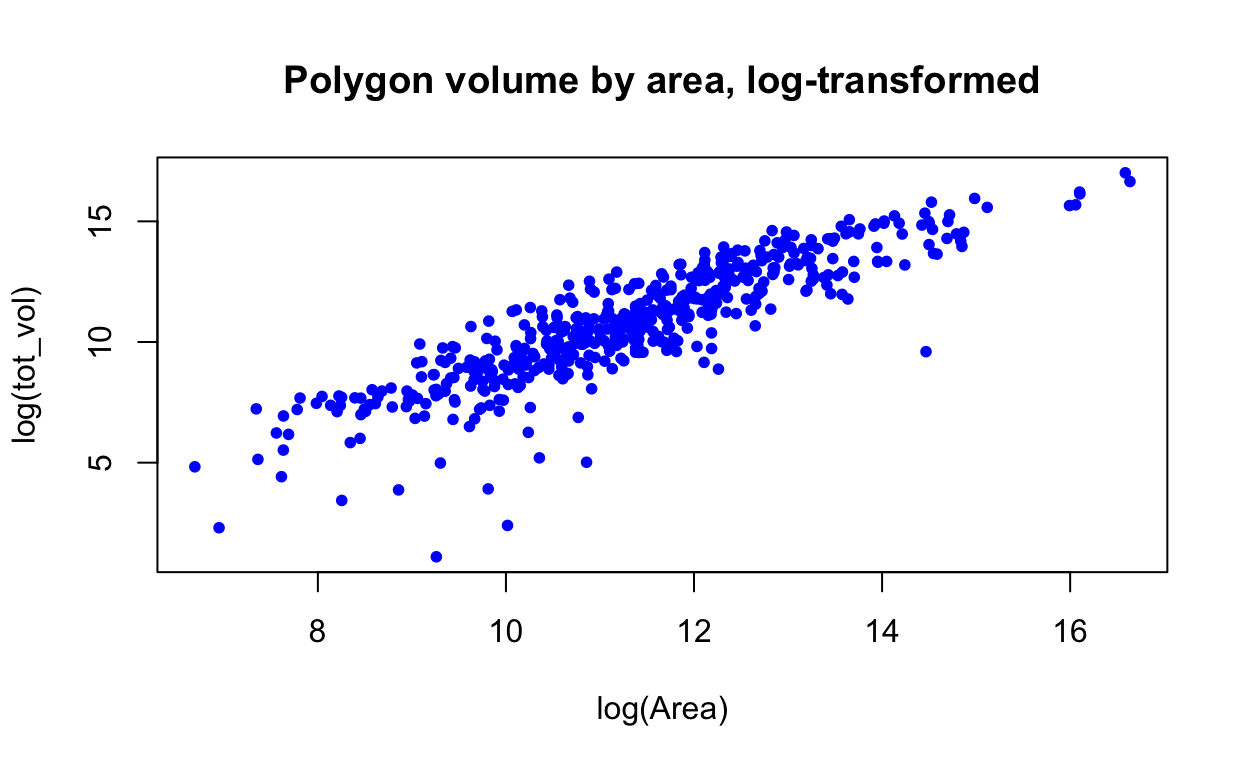
# Log-transform variables and make the points blue dots, because why not?
with(polygon, plot(log(tot_vol) ~ log(Area), # log-transform
                   pch = 20, # dots instead of circles
                   col = "blue", # make the dots blue
                   main = "Polygon volume by area, log-transformed") # title
     )
It’s worth noting that this works for other functions besides plot(), too. Here’s an example with table(): let’s look at how many sampling polygons include revetment, broken down by navigation pool (area of the river). The data set contains three navigation pools: 4, 8, and 13.
         pool
revetment   4   8  13
        0  71 199 103
        1  57  53  44
Outcome
Quick plots and data manipulation made even quicker!
Resources
Discussion of when to use with(): https://stackoverflow.com/questions/42283479/when-to-use-with-function-and-why-is-it-good